United Healthcare 2006 Annual Report Download - page 39
Download and view the complete annual report
Please find page 39 of the 2006 United Healthcare annual report below. You can navigate through the pages in the report by either clicking on the pages listed below, or by using the keyword search tool below to find specific information within the annual report.-
 1
1 -
2
-
3
-
4
-
5
-
6
-
7
-
8
-
9
-
10
-
11
-
12
-
13
-
14
-
15
-
16
-
17
-
18
-
19
-
20
-
21
-
22
-
23
-
24
-
25
-
26
-
27
-
28
-
 29
29 -
 30
30 -
 31
31 -
 32
32 -
 33
33 -
 34
34 -
 35
35 -
 36
36 -
 37
37 -
 38
38 -
 39
39 -
 40
40 -
 41
41 -
 42
42 -
 43
43 -
 44
44 -
 45
45 -
 46
46 -
 47
47 -
 48
48 -
 49
49 -
50
-
51
-
52
-
53
-
54
-
55
-
56
-
57
-
58
-
59
-
60
-
61
-
62
-
63
-
64
-
65
-
66
-
67
-
68
-
69
-
70
-
71
-
72
-
73
-
74
-
75
-
76
-
77
-
78
-
79
-
80
-
81
-
82
-
83
-
84
-
85
-
86
-
87
-
88
-
89
-
90
-
91
-
92
-
93
-
94
-
95
-
96
-
97
-
98
-
99
-
100
-
101
-
102
-
103
-
104
-
105
-
106
-
107
-
108
-
109
-
110
-
111
-
112
-
113
-
114
-
115
-
116
-
117
-
118
-
119
-
120
-
121
-
122
-
123
-
124
-
125
-
126
-
127
-
128
-
129
-
130
 |
 |
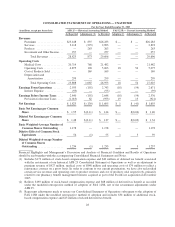
$4.0 billion increased by $1.2 billion, or 42%, over 2005. Excluding the impact of acquisitions, revenues
increased by 22% over the prior periods. This increase was principally driven by an increase in the number of
individuals served by several of its specialty benefit businesses and rate increases related to these businesses.
Earnings from operations in 2006 of $769 million increased $228 million, or 42%, over 2005. Specialized Care
Services’ operating margin was 19.3% in 2006 and 2005. Realized improvements in operating cost structure and
benefits from the integration of PacifiCare specialty operations in 2006 were offset by a business mix shift
toward higher revenue, lower margin products.
Ingenix
Ingenix offers database and data management services, software products, publications, consulting services,
outsourced services and pharmaceutical development and consulting services on a national and international
basis. Ingenix revenues for 2006 of $976 million increased by $169 million, or 21%, over 2005. This was driven
primarily by new business growth in the health information and contract research businesses, as well as
businesses acquired since the beginning of 2005.
Earnings from operations in 2006 were $190 million, up $55 million, or 41%, from 2005. Operating margin was
19.5% in 2006, up from 16.7% in 2005. These increases in earnings from operations and operating margin were
primarily due to growth in the health information and pharmaceutical services businesses, improving gross
margins due to effective cost management and businesses acquired since the beginning of 2005.
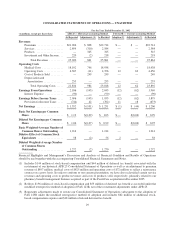
2005 Results Compared to 2004 Results
Consolidated Financial Results
Revenues
Consolidated revenues in 2005 increased by $8.2 billion, or 21%, to $46.4 billion. Excluding the impact of
businesses acquired since the beginning of 2004, consolidated revenues increased by approximately 11% in 2005
primarily as a result of rate increases on premium-based and fee-based services and growth in individuals served
across business segments. Following is a discussion of 2005 consolidated revenue trends for each of our revenue
components.
Premium Revenues Consolidated premium revenues totaled $42.1 billion in 2005, an increase of $7.7 billion, or
22%, over 2004. Excluding the impact of acquisitions, consolidated premium revenues increased by
approximately 11% over 2004. This increase was primarily driven by premium rate increases and a modest
increase in the number of individuals served by our risk-based products.
UnitedHealthcare premium revenues in 2005 totaled $25.9 billion, an increase of $5.1 billion, or 24%, over 2004.
Excluding premium revenues from businesses acquired since the beginning of 2004, UnitedHealthcare premium
revenues increased by approximately 9% over 2004. This increase was primarily due to average net premium rate
increases of approximately 8% to 9% on UnitedHealthcare’s renewing commercial risk-based products. In
addition, Ovations premium revenues in 2005 totaled $9.2 billion, an increase of $1.8 billion, or 24%, over 2004.
Excluding the impact of acquisitions, Ovations premium revenues increased by approximately 20% over 2004,
driven primarily by an increase in the number of individuals served by Medicare Advantage products and by
Medicare supplement products provided to AARP members, as well as rate increases on these products. Premium
revenues from AmeriChoice’s Medicaid programs in 2005 totaled $3.3 billion, an increase of $270 million, or
9%, over 2004 driven primarily by premium rate increases. The remaining premium revenue increase is due
mainly to strong growth in the number of individuals served by several Specialized Care Services businesses
under premium-based arrangements.
Service Revenues Service revenues in 2005 totaled $3.7 billion, an increase of $423 million, or 13%, over 2004.
The increase in service revenues was driven primarily by aggregate growth of 8% in the number of individuals
37