United Healthcare 2006 Annual Report Download - page 29
Download and view the complete annual report
Please find page 29 of the 2006 United Healthcare annual report below. You can navigate through the pages in the report by either clicking on the pages listed below, or by using the keyword search tool below to find specific information within the annual report.-
 1
1 -
2
-
3
-
4
-
5
-
6
-
7
-
8
-
9
-
10
-
11
-
12
-
13
-
14
-
15
-
16
-
17
-
18
-
 19
19 -
 20
20 -
 21
21 -
 22
22 -
 23
23 -
 24
24 -
 25
25 -
 26
26 -
 27
27 -
 28
28 -
 29
29 -
 30
30 -
 31
31 -
 32
32 -
 33
33 -
 34
34 -
 35
35 -
 36
36 -
 37
37 -
 38
38 -
 39
39 -
40
-
41
-
42
-
43
-
44
-
45
-
46
-
47
-
48
-
49
-
50
-
51
-
52
-
53
-
54
-
55
-
56
-
57
-
58
-
59
-
60
-
61
-
62
-
63
-
64
-
65
-
66
-
67
-
68
-
69
-
70
-
71
-
72
-
73
-
74
-
75
-
76
-
77
-
78
-
79
-
80
-
81
-
82
-
83
-
84
-
85
-
86
-
87
-
88
-
89
-
90
-
91
-
92
-
93
-
94
-
95
-
96
-
97
-
98
-
99
-
100
-
101
-
102
-
103
-
104
-
105
-
106
-
107
-
108
-
109
-
110
-
111
-
112
-
113
-
114
-
115
-
116
-
117
-
118
-
119
-
120
-
121
-
122
-
123
-
124
-
125
-
126
-
127
-
128
-
129
-
130
 |
 |

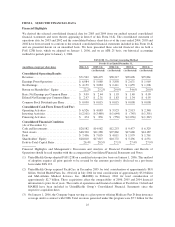
Financial Highlights
APB 25 (1) — Historical Accounting Method
For the Year Ended December 31,
(in millions, except per share data) 2005 (2,3) 2004 (2,3) 2003 (3) 2002 (3)
(As Restated) (As Restated) (As Restated) (As Restated)
Consolidated Operating Results
Revenues ...................................... $46,425 $38,217 $29,696 $25,861
Earnings From Operations ......................... $ 5,069 $ 3,901 $ 2,743 $ 2,043
Net Earnings ................................... $ 3,062 $ 2,429 $ 1,695 $ 1,251
Return on Shareholders’ Equity ..................... 25.1% 29.5% 36.0% 30.3%
Basic Net Earnings per Common Share .............. $ 2.42 $ 1.94 $ 1.44 $ 1.03
Diluted Net Earnings per Common Share ............. $ 2.31 $ 1.86 $ 1.37 $ 0.99
Common Stock Dividends per Share ................. $ 0.015 $ 0.015 $ 0.008 $ 0.008
Consolidated Cash Flows From (Used For)
Operating Activities .............................. $ 4,326 $ 4,147 $ 3,003 $ 2,423
Investing Activities .............................. $(3,489) $ (1,644) $ (745) $ (1,391)
Financing Activities .............................. $ 593 $ (774) $ (1,126) $ (1,442)
Consolidated Financial Condition
(As of December 31)
Cash and Investments ............................ $14,982 $12,253 $ 9,477 $ 6,329
Total Assets .................................... $41,288 $27,862 $17,668 $14,187
Debt .......................................... $ 7,095 $ 4,011 $ 1,979 $ 1,761
Shareholders’ Equity ............................. $17,788 $10,725 $ 5,174 $ 4,495
Debt-to-Total-Capital Ratio ........................ 28.5% 27.2% 27.7% 28.1%
Financial Highlights and Management’s Discussion and Analysis of Financial Condition and Results of
Operations should be read together with the accompanying Consolidated Financial Statements and Notes.
(1) UnitedHealth Group’s historical accounting policy for stock-based compensation followed the recognition
and measurement principles of APB 25. Furthermore, UnitedHealth Group complied with the disclosure
provisions of FAS 123.
(2) UnitedHealth Group acquired PacifiCare in December 2005 for total consideration of approximately $8.8
billion, Oxford in July 2004 for total consideration of approximately $5.0 billion and MAMSI in February
2004 for total consideration of approximately $2.7 billion. These acquisitions affect the comparability of
2006, 2005 and 2004 financial information to prior fiscal years. The results of operations and financial
condition of PacifiCare, Oxford and MAMSI have been included in UnitedHealth Group’s Consolidated
Financial Statements since the respective acquisition dates. See Note 5 of the Notes to Consolidated
Financial Statements for a detailed discussion of these acquisitions.
(3) The unaudited Consolidated Statements of Operations and Cash Flows data for 2003 and 2002, and the
unaudited Consolidated Balance Sheets data as of December 31, 2004, 2003 and 2002 have been revised to
reflect adjustments related to the restatement described under “Management’s Discussion and Analysis of
Financial Condition and Results of Operations” and Note 3 of the Notes to Consolidated Financial
Statements. Pre-tax adjustments related to 2003 and 2002 include non-cash stock-based compensation
expense totaling $172 million and $144 million, respectively under APB 25, our historical accounting
method. The cumulative after tax impact of all restatement adjustments related to years prior to 2002 totaled
$507 million under APB 25, our historical accounting method, and has been reflected as an adjustment to
retained earnings at December 31, 2001. The following tables reflect the detailed unaudited 2003 and 2002
Statement of Operations adjustments under APB 25 and FAS 123R.
27