Under Armour 2015 Annual Report Download - page 89
Download and view the complete annual report
Please find page 89 of the 2015 Under Armour annual report below. You can navigate through the pages in the report by either clicking on the pages listed below, or by using the keyword search tool below to find specific information within the annual report.-
 1
1 -
2
-
3
-
4
-
5
-
6
-
7
-
8
-
9
-
10
-
11
-
12
-
13
-
14
-
15
-
16
-
17
-
18
-
19
-
20
-
21
-
22
-
23
-
24
-
25
-
26
-
27
-
28
-
29
-
30
-
31
-
32
-
33
-
34
-
35
-
36
-
37
-
38
-
39
-
40
-
41
-
42
-
43
-
44
-
45
-
46
-
47
-
48
-
49
-
50
-
51
-
52
-
53
-
54
-
55
-
56
-
57
-
58
-
59
-
60
-
61
-
62
-
63
-
64
-
65
-
66
-
67
-
68
-
69
-
70
-
71
-
72
-
73
-
74
-
75
-
76
-
77
-
78
-
 79
79 -
 80
80 -
 81
81 -
 82
82 -
 83
83 -
 84
84 -
 85
85 -
 86
86 -
 87
87 -
 88
88 -
 89
89 -
 90
90 -
 91
91 -
 92
92 -
 93
93 -
 94
94 -
 95
95 -
 96
96 -
 97
97 -
 98
98 -
 99
99 -
100
-
101
-
102
-
103
-
104
 |
 |

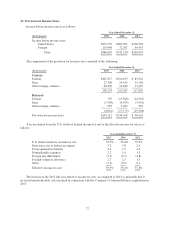
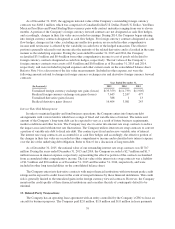
Net revenues by product category are as follows:
Year Ended December 31,
(In thousands) 2015 2014 2013
Apparel $2,801,062 $2,291,520 $1,762,150
Footwear 677,744 430,987 298,825
Accessories 346,885 275,409 216,098
Total net sales 3,825,691 2,997,916 2,277,073
Licensing revenues 84,207 67,229 53,910
Connected Fitness 53,415 19,225 1,068
Total net revenues $3,963,313 $3,084,370 $2,332,051
As of December 31, 2015 and 2014, the majority of the Company’s long-lived assets were located in the
United States. Net revenues in the United States were $3,268.8 million, $2,651.1 million and $2,082.5 million for
the years ended December 31, 2015, 2014 and 2013, respectively.
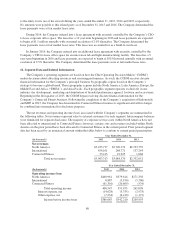
17. Unaudited Quarterly Financial Data
Quarter Ended (unaudited) Year Ended
December 31,(In thousands) March 31, June 30, September 30, December 31,
2015
Net revenues $804,941 $783,577 $1,204,109 $1,170,686 $3,963,313
Gross profit 377,664 379,053 587,160 561,670 1,905,547
Income from operations 27,667 31,901 171,397 177,582 408,547
Net income 11,728 14,766 100,477 105,602 232,573
Earnings per share-basic $ 0.05 $ 0.07 $ 0.47 $ 0.49 $ 1.08
Earnings per share-diluted $ 0.05 $ 0.07 $ 0.45 $ 0.48 $ 1.05
2014
Net revenues $641,607 $609,654 $ 937,908 $ 895,201 $3,084,370
Gross profit 300,690 299,952 465,300 446,264 1,512,206
Income from operations 26,856 34,694 146,106 146,299 353,955
Net income 13,538 17,690 89,105 87,709 208,042
Earnings per share-basic $ 0.06 $ 0.08 $ 0.42 $ 0.41 $ 0.98
Earnings per share-diluted $ 0.06 $ 0.08 $ 0.41 $ 0.40 $ 0.95
81