Under Armour 2015 Annual Report Download - page 43
Download and view the complete annual report
Please find page 43 of the 2015 Under Armour annual report below. You can navigate through the pages in the report by either clicking on the pages listed below, or by using the keyword search tool below to find specific information within the annual report.-
 1
1 -
2
-
3
-
4
-
5
-
6
-
7
-
8
-
9
-
10
-
11
-
12
-
13
-
14
-
15
-
16
-
17
-
18
-
19
-
20
-
21
-
22
-
23
-
24
-
25
-
26
-
27
-
28
-
29
-
30
-
31
-
32
-
 33
33 -
 34
34 -
 35
35 -
 36
36 -
 37
37 -
 38
38 -
 39
39 -
 40
40 -
 41
41 -
 42
42 -
 43
43 -
 44
44 -
 45
45 -
 46
46 -
 47
47 -
 48
48 -
 49
49 -
 50
50 -
 51
51 -
 52
52 -
 53
53 -
54
-
55
-
56
-
57
-
58
-
59
-
60
-
61
-
62
-
63
-
64
-
65
-
66
-
67
-
68
-
69
-
70
-
71
-
72
-
73
-
74
-
75
-
76
-
77
-
78
-
79
-
80
-
81
-
82
-
83
-
84
-
85
-
86
-
87
-
88
-
89
-
90
-
91
-
92
-
93
-
94
-
95
-
96
-
97
-
98
-
99
-
100
-
101
-
102
-
103
-
104
 |
 |

Selling, general and administrative expenses increased $286.7 million to $1,158.3 million in 2014 from
$871.6 million in 2013. As a percentage of net revenues, selling, general and administrative expenses increased
to 37.5% in 2014 from 37.3% in 2013. These changes were primarily attributable to the following:
• Marketing costs increased $86.5 million to $333.0 million in 2014 from $246.5 million in 2013
primarily due to increased global sponsorship of professional teams and athletes. As a percentage of net
revenues, marketing costs increased to 10.8% in 2014 from 10.5%.
• Other costs increased increased $200.2 million to $825.3 million in 2014 from $625.1 million in 2013.
This increase was primarily due to higher personnel and other costs incurred for the continued
expansion of our direct to consumer distribution channel, including increased investment for our brand
house stores. This increase was also due to additional investment in our Connected Fitness business. As
a percentage of net revenues, other costs were unchanged at 26.8% in 2014 and 2013.
Income from operations increased $88.9 million, or 33.5%, to $354.0 million in 2014 from $265.1 million in
2013. Income from operations as a percentage of net revenues increased to 11.5% in 2014 from 11.4% in 2013.
Interest expense, net increased $2.4 million to $5.3 million in 2014 from $2.9 million in 2013. This increase
was primarily due to the $150.0 million and $100.0 million term loans borrowed during 2014.
Other expense, net increased $5.2 million to $6.4 million in 2014 from $1.2 million in 2013. This increase was
due to higher net losses in 2014 on the combined foreign currency exchange rate changes on transactions
denominated in foreign currencies and our foreign currency derivative financial instruments as compared to 2013.
Provision for income taxes increased $35.5 million to $134.2 million in 2014 from $98.7 million in 2013.
Our effective tax rate was 39.2% in 2014 compared to 37.8% in 2013. Our effective tax rate for 2014 was higher
than the effective tax rate for 2013 primarily due to increased foreign investments driving a lower proportion of
foreign taxable income in 2014 and state tax credits received in 2013.
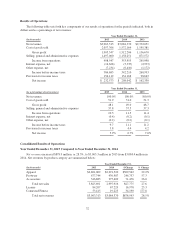
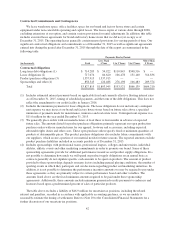
Segment Results of Operations
The net revenues and operating income (loss) associated with our segments are summarized in the following
tables. The majority of corporate expenses within North America have not been allocated to international or
Connected Fitness; however, certain costs and revenues included within North America in the prior period have
been allocated to Connected Fitness in the current period. Prior period segment data has been recast by an
immaterial amount within the tables to conform to the current period presentation.
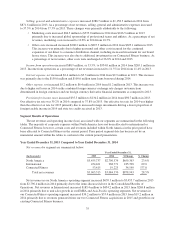
Year Ended December 31, 2015 Compared to Year Ended December 31, 2014
Net revenues by segment are summarized below:
Year Ended December 31,
(In thousands) 2015 2014 $ Change % Change
North America $3,455,737 $2,796,374 $659,363 23.6%
International 454,161 268,771 185,390 69.0
Connected Fitness 53,415 19,225 34,190 177.8
Total net revenues $3,963,313 $3,084,370 $878,943 28.5%
Net revenues in our North America operating segment increased $659.3 million to $3,455.7 million in 2015
from $2,796.4 million in 2014 primarily due to the items discussed above in the Consolidated Results of
Operations. Net revenues in International increased $185.4 million to $454.2 million in 2015 from $268.8 million
in 2014 primarily due to unit sales growth in our EMEA and Asia-Pacific operating segments. Net revenues in
our Connected Fitness operating segment increased $34.2 million to $53.4 million in 2015 from $19.2 million in
2014 primarily due to revenues generated from our two Connected Fitness acquisitions in 2015 and growth in our
existing Connected Fitness business.
35