Under Armour 2015 Annual Report Download - page 12
Download and view the complete annual report
Please find page 12 of the 2015 Under Armour annual report below. You can navigate through the pages in the report by either clicking on the pages listed below, or by using the keyword search tool below to find specific information within the annual report.-
 1
1 -
 2
2 -
 3
3 -
 4
4 -
 5
5 -
 6
6 -
 7
7 -
 8
8 -
 9
9 -
 10
10 -
 11
11 -
 12
12 -
 13
13 -
 14
14 -
 15
15 -
 16
16 -
 17
17 -
 18
18 -
 19
19 -
 20
20 -
 21
21 -
 22
22 -
23
-
24
-
25
-
26
-
27
-
28
-
29
-
30
-
31
-
32
-
33
-
34
-
35
-
36
-
37
-
38
-
39
-
40
-
41
-
42
-
43
-
44
-
45
-
46
-
47
-
48
-
49
-
50
-
51
-
52
-
53
-
54
-
55
-
56
-
57
-
58
-
59
-
60
-
61
-
62
-
63
-
64
-
65
-
66
-
67
-
68
-
69
-
70
-
71
-
72
-
73
-
74
-
75
-
76
-
77
-
78
-
79
-
80
-
81
-
82
-
83
-
84
-
85
-
86
-
87
-
88
-
89
-
90
-
91
-
92
-
93
-
94
-
95
-
96
-
97
-
98
-
99
-
100
-
101
-
102
-
103
-
104
 |
 |

We believe the trend toward performance products is global and plan to continue to introduce our products
and simple merchandising story to athletes throughout the world. We are introducing our performance apparel,
footwear and accessories outside of North America in a manner consistent with our past brand-building strategy,
including selling our products directly to teams and individual athletes in these markets, thereby providing us
with product exposure to broad audiences of potential consumers.
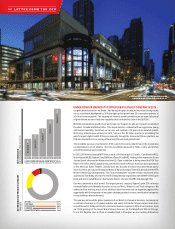
Our primary business operates in four geographic segments: (1) North America, comprising the United
States and Canada, (2) EMEA, (3) Asia-Pacific, and (4) Latin America. Each of these geographic segments
operate predominantly in one industry: the design, development, marketing and distribution of performance
apparel, footwear and accessories. We also operate our Connected Fitness business as a separate segment. As our
international operating segments are currently not material, we combine them and refer to the collectively as
International for reporting purposes. The following table presents net revenues by segment for each of the years
ending December 31, 2015, 2014 and 2013:
Year ended December 31,
2015 2014 2013
(In thousands) Net Revenues
%of
Net Revenues Net Revenues
%of
Net Revenues Net Revenues
%of
Net Revenues
North America $3,455,737 87.2% $2,796,374 90.7% $2,193,739 94.1%
International 454,161 11.5 268,771 8.7 137,244 5.9
Connected Fitness 53,415 1.3 19,225 0.6 1,068 —
Total net revenues $3,963,313 100.0% $3,084,370 100.0% $2,332,051 100.0%
North America
North America accounted for approximately 87% of our net revenues for 2015. We sell our branded apparel,
footwear and accessories in North America through our wholesale and direct to consumer channels. Net revenues
generated from the sales of our products in the United States were $3,267.0 million, $2,651.1 million and
$2,082.5 million for the years ended December 31, 2015, 2014 and 2013, respectively, and the majority of our
long-lived assets were located in the United States. Our largest customer, Dick’s Sporting Goods, accounted for
11.5% of our net revenues in 2015. No other customers accounted for more than 10% of our net revenues.
Our direct to consumer sales are generated through our brand and factory house stores, along with internet
websites. As of December 31, 2015, we had 143 factory house stores in North America primarily located in
outlet centers throughout the United States. As of December 31, 2015, we had 10 brand house stores in North
America. Consumers can purchase our products directly from our e-commerce website, www.underarmour.com.
In addition, we earn licensing revenue in North America based on our licensees’ collegiate and MLB
apparel and accessories, baby and kids’ apparel, team uniforms, socks, water bottles, eyewear and inflatable
footballs and basketballs and other specific hard goods equipment. In order to maintain consistent quality and
performance, we pre-approve all products manufactured and sold by our licensees, and our quality assurance
team strives to ensure that the products meet the same quality and compliance standards as the products that we
sell directly.
We distribute the majority of our products sold to our North American wholesale customers and our brand
and factory house stores from distribution facilities we lease and operate in California, Maryland and Tennessee.
In addition, we distribute our products in North America through third-party logistics providers with primary
locations in Canada, New Jersey and Florida. In some instances, we arrange to have products shipped from the
factories that manufacture our products directly to customer-designated facilities.
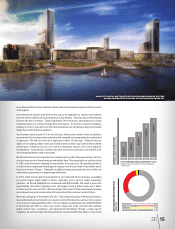
International
Approximately 11% of our net revenues were generated outside of North America in 2015. We plan to
continue to grow our business over the long term in part through expansion in international markets.
4