Under Armour 2015 Annual Report Download - page 40
Download and view the complete annual report
Please find page 40 of the 2015 Under Armour annual report below. You can navigate through the pages in the report by either clicking on the pages listed below, or by using the keyword search tool below to find specific information within the annual report.-
 1
1 -
2
-
3
-
4
-
5
-
6
-
7
-
8
-
9
-
10
-
11
-
12
-
13
-
14
-
15
-
16
-
17
-
18
-
19
-
20
-
21
-
22
-
23
-
24
-
25
-
26
-
27
-
28
-
29
-
 30
30 -
 31
31 -
 32
32 -
 33
33 -
 34
34 -
 35
35 -
 36
36 -
 37
37 -
 38
38 -
 39
39 -
 40
40 -
 41
41 -
 42
42 -
 43
43 -
 44
44 -
 45
45 -
 46
46 -
 47
47 -
 48
48 -
 49
49 -
 50
50 -
51
-
52
-
53
-
54
-
55
-
56
-
57
-
58
-
59
-
60
-
61
-
62
-
63
-
64
-
65
-
66
-
67
-
68
-
69
-
70
-
71
-
72
-
73
-
74
-
75
-
76
-
77
-
78
-
79
-
80
-
81
-
82
-
83
-
84
-
85
-
86
-
87
-
88
-
89
-
90
-
91
-
92
-
93
-
94
-
95
-
96
-
97
-
98
-
99
-
100
-
101
-
102
-
103
-
104
 |
 |

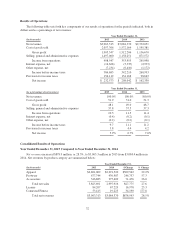
Results of Operations
The following table sets forth key components of our results of operations for the periods indicated, both in
dollars and as a percentage of net revenues:
Year Ended December 31,
(In thousands) 2015 2014 2013
Net revenues $3,963,313 $3,084,370 $2,332,051
Cost of goods sold 2,057,766 1,572,164 1,195,381
Gross profit 1,905,547 1,512,206 1,136,670
Selling, general and administrative expenses 1,497,000 1,158,251 871,572
Income from operations 408,547 353,955 265,098
Interest expense, net (14,628) (5,335) (2,933)
Other expense, net (7,234) (6,410) (1,172)
Income before income taxes 386,685 342,210 260,993
Provision for income taxes 154,112 134,168 98,663
Net income $ 232,573 $ 208,042 $ 162,330
Year Ended December 31,
(As a percentage of net revenues) 2015 2014 2013
Net revenues 100.0% 100.0% 100.0%
Cost of goods sold 51.9 51.0 51.3
Gross profit 48.1 49.0 48.7
Selling, general and administrative expenses 37.8 37.5 37.3
Income from operations 10.3 11.5 11.4
Interest expense, net (0.4) (0.2) (0.1)
Other expense, net (0.2) (0.2) (0.1)
Income before income taxes 9.7 11.1 11.2
Provision for income taxes 3.8 4.4 4.2
Net income 5.9% 6.7% 7.0%
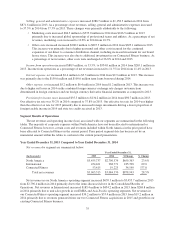
Consolidated Results of Operations
Year Ended December 31, 2015 Compared to Year Ended December 31, 2014
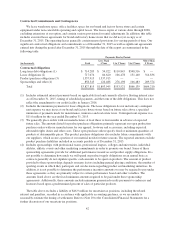
Net revenues increased $878.9 million, or 28.5%, to $3,963.3 million in 2015 from $3,084.4 million in
2014. Net revenues by product category are summarized below:
Year Ended December 31,
(In thousands) 2015 2014 $ Change % Change
Apparel $2,801,062 $2,291,520 $509,542 22.2%
Footwear 677,744 430,987 246,757 57.3
Accessories 346,885 275,409 71,476 26.0
Total net sales 3,825,691 2,997,916 827,775 27.6
License 84,207 67,229 16,978 25.3
Connected Fitness 53,415 19,225 34,190 177.8
Total net revenues $3,963,313 $3,084,370 $878,943 28.5%
32