Under Armour 2015 Annual Report Download - page 88
Download and view the complete annual report
Please find page 88 of the 2015 Under Armour annual report below. You can navigate through the pages in the report by either clicking on the pages listed below, or by using the keyword search tool below to find specific information within the annual report.-
 1
1 -
2
-
3
-
4
-
5
-
6
-
7
-
8
-
9
-
10
-
11
-
12
-
13
-
14
-
15
-
16
-
17
-
18
-
19
-
20
-
21
-
22
-
23
-
24
-
25
-
26
-
27
-
28
-
29
-
30
-
31
-
32
-
33
-
34
-
35
-
36
-
37
-
38
-
39
-
40
-
41
-
42
-
43
-
44
-
45
-
46
-
47
-
48
-
49
-
50
-
51
-
52
-
53
-
54
-
55
-
56
-
57
-
58
-
59
-
60
-
61
-
62
-
63
-
64
-
65
-
66
-
67
-
68
-
69
-
70
-
71
-
72
-
73
-
74
-
75
-
76
-
77
-
 78
78 -
 79
79 -
 80
80 -
 81
81 -
 82
82 -
 83
83 -
 84
84 -
 85
85 -
 86
86 -
 87
87 -
 88
88 -
 89
89 -
 90
90 -
 91
91 -
 92
92 -
 93
93 -
 94
94 -
 95
95 -
 96
96 -
 97
97 -
 98
98 -
99
-
100
-
101
-
102
-
103
-
104
 |
 |

to the entity for its use of the aircraft during the years ended December 31, 2015, 2014 and 2013, respectively.
No amounts were payable to this related party as of December 31, 2015 and 2014. The Company determined the
lease payments were at fair market lease rates.
During 2014, the Company entered into a lease agreement with an entity controlled by the Company’s CEO
to lease corporate office space. The lease has a 10 year term beginning in 2016 and lease payments are expected
to begin at $1.1 million annually with an annual escalation of 2.0% thereafter. The Company determined the
lease payments were at fair market lease rates. This lease was accounted for as a build-to-suit lease.
In January 2016, the Company entered into an additional lease agreement with an entity controlled by the
Company’s CEO to lease office space for an innovation lab and light-manufacturing facility. The lease has a 5
year term beginning in 2016 and lease payments are expected to begin at $515 thousand annually with an annual
escalation of 2.5% thereafter. The Company determined the lease payments were at fair market lease rates.
16. Segment Data and Related Information
The Company’s operating segments are based on how the Chief Operating Decision Maker (“CODM”)
makes decisions about allocating resources and assessing performance. As such, the CODM receives discrete
financial information for the Company’s principal business by geographic region based on the Company’s
strategy to become a global brand. These geographic regions include North America; Latin America; Europe, the
Middle East and Africa (“EMEA”); and Asia-Pacific. Each geographic segment operates exclusively in one
industry: the development, marketing and distribution of branded performance apparel, footwear and accessories.
Beginning in the first quarter of 2015, the CODM began receiving discrete financial information for the
Company’s Connected Fitness business. Following the completion of the Company’s acquisition of Endomondo
and MFP in 2015, the Company has determined its Connected Fitness business is significant and will no longer
be combined into international for disclosure purposes.
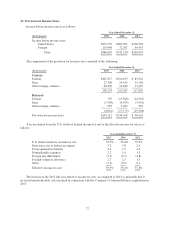
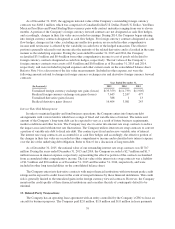
The net revenues and operating income (loss) associated with the Company’s segments are summarized in
the following tables. Net revenues represent sales to external customers for each segment. Intercompany balances
were eliminated for separate disclosure. The majority of corporate service costs within North America have not
been allocated to international or Connected Fitness; however, certain costs and revenues included within North
America in the prior period have been allocated to Connected Fitness in the current period. Prior period segment
data has been recast by an immaterial amount within the tables below to conform to current period presentation.
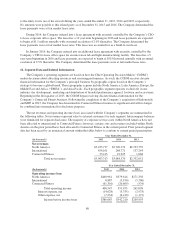
Year Ended December 31,
(In thousands) 2015 2014 2013
Net revenues
North America $3,455,737 $2,796,374 $2,193,739
International 454,161 268,771 137,244
Connected Fitness 53,415 19,225 1,068
Total net revenues $3,963,313 $3,084,370 $2,332,051
Year Ended December 31,
(In thousands) 2015 2014 2013
Operating income (loss)
North America $460,961 $379,814 $271,338
International 8,887 (5,190) (5,706)
Connected Fitness (61,301) (20,669) (534)
Total operating income 408,547 353,955 265,098
Interest expense, net (14,628) (5,335) (2,933)
Other expense, net (7,234) (6,410) (1,172)
Income before income taxes $386,685 $342,210 $260,993
80