Under Armour 2015 Annual Report Download - page 42
Download and view the complete annual report
Please find page 42 of the 2015 Under Armour annual report below. You can navigate through the pages in the report by either clicking on the pages listed below, or by using the keyword search tool below to find specific information within the annual report.-
 1
1 -
2
-
3
-
4
-
5
-
6
-
7
-
8
-
9
-
10
-
11
-
12
-
13
-
14
-
15
-
16
-
17
-
18
-
19
-
20
-
21
-
22
-
23
-
24
-
25
-
26
-
27
-
28
-
29
-
30
-
31
-
 32
32 -
 33
33 -
 34
34 -
 35
35 -
 36
36 -
 37
37 -
 38
38 -
 39
39 -
 40
40 -
 41
41 -
 42
42 -
 43
43 -
 44
44 -
 45
45 -
 46
46 -
 47
47 -
 48
48 -
 49
49 -
 50
50 -
 51
51 -
 52
52 -
53
-
54
-
55
-
56
-
57
-
58
-
59
-
60
-
61
-
62
-
63
-
64
-
65
-
66
-
67
-
68
-
69
-
70
-
71
-
72
-
73
-
74
-
75
-
76
-
77
-
78
-
79
-
80
-
81
-
82
-
83
-
84
-
85
-
86
-
87
-
88
-
89
-
90
-
91
-
92
-
93
-
94
-
95
-
96
-
97
-
98
-
99
-
100
-
101
-
102
-
103
-
104
 |
 |

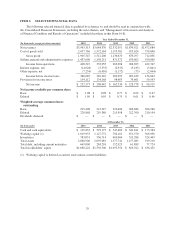
Other expense, net increased $0.8 million to $7.2 million in 2015 from $6.4 million in 2014. This increase
was due to higher net losses on the combined foreign currency exchange rate changes on transactions
denominated in foreign currencies and our foreign currency derivative financial instruments in 2015.
Provision for income taxes increased $19.9 million to $154.1 million in 2015 from $134.2 million in 2014.
Our effective tax rate was 39.9% in 2015 compared to 39.2% in 2014. Our effective tax rate for 2015 was higher
than the effective tax rate for 2014 primarily due to increased non-deductible costs incurred in connection with
our Connected Fitness acquisitions in 2015.
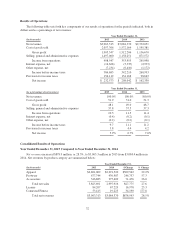
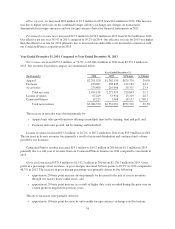
Year Ended December 31, 2014 Compared to Year Ended December 31, 2013
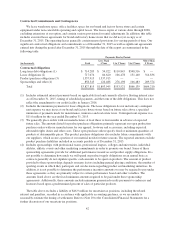
Net revenues increased $752.3 million, or 32.3%, to $3,084.4 million in 2014 from $2,332.1 million in
2013. Net revenues by product category are summarized below:
Year Ended December 31,
(In thousands) 2014 2013 $ Change % Change
Apparel $2,291,520 $1,762,150 $529,370 30.0%
Footwear 430,987 298,825 132,162 44.2
Accessories 275,409 216,098 59,311 27.4
Total net sales 2,997,916 2,277,073 720,843 31.7
License revenues 67,229 53,910 13,319 24.7
Connected Fitness 19,225 1,068 18,157 1,700.1
Total net revenues $3,084,370 $2,332,051 $752,319 32.3%
The increase in net sales were driven primarily by:
• Apparel unit sales growth and new offerings in multiple lines led by training, hunt and golf; and
• Footwear unit sales growth, led by running and basketball.
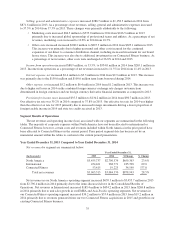
License revenues increased $13.3 million, or 24.7%, to $67.2 million in 2014 from $53.9 million in 2013.
This increase in license revenues was primarily a result of increased distribution and continued unit volume
growth by our licensees.
Connected Fitness revenue increased $18.1 million to $19.2 million in 2014 from $1.1 million in 2013
primarily due to a full year of revenue from our Connected Fitness business in 2014 compared to one month in
2013.
Gross profit increased $375.5 million to $1,512.2 million in 2014 from $1,136.7 million in 2013. Gross
profit as a percentage of net revenues, or gross margin, increased 30 basis points to 49.0% in 2014 compared to
48.7% in 2013. The increase in gross margin percentage was primarily driven by the following:
• approximate 20 basis point increase driven primarily by decreased sales mix of excess inventory
through our factory house outlet stores; and
• approximate 20 basis point increase as a result of higher duty costs recorded during the prior year on
certain products imported in previous years.
The above increases were partially offset by:
• approximate 10 basis point decrease by unfavorable foreign currency exchange rate fluctuations.
34