Under Armour 2015 Annual Report Download - page 63
Download and view the complete annual report
Please find page 63 of the 2015 Under Armour annual report below. You can navigate through the pages in the report by either clicking on the pages listed below, or by using the keyword search tool below to find specific information within the annual report.-
 1
1 -
2
-
3
-
4
-
5
-
6
-
7
-
8
-
9
-
10
-
11
-
12
-
13
-
14
-
15
-
16
-
17
-
18
-
19
-
20
-
21
-
22
-
23
-
24
-
25
-
26
-
27
-
28
-
29
-
30
-
31
-
32
-
33
-
34
-
35
-
36
-
37
-
38
-
39
-
40
-
41
-
42
-
43
-
44
-
45
-
46
-
47
-
48
-
49
-
50
-
51
-
52
-
 53
53 -
 54
54 -
 55
55 -
 56
56 -
 57
57 -
 58
58 -
 59
59 -
 60
60 -
 61
61 -
 62
62 -
 63
63 -
 64
64 -
 65
65 -
 66
66 -
 67
67 -
 68
68 -
 69
69 -
 70
70 -
 71
71 -
 72
72 -
 73
73 -
74
-
75
-
76
-
77
-
78
-
79
-
80
-
81
-
82
-
83
-
84
-
85
-
86
-
87
-
88
-
89
-
90
-
91
-
92
-
93
-
94
-
95
-
96
-
97
-
98
-
99
-
100
-
101
-
102
-
103
-
104
 |
 |

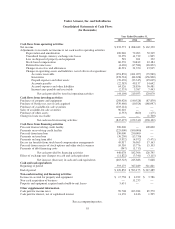
Under Armour, Inc. and Subsidiaries
Consolidated Statements of Cash Flows
(In thousands)
Year Ended December 31,
2015 2014 2013
Cash flows from operating activities
Net income $ 232,573 $ 208,042 $ 162,330
Adjustments to reconcile net income to net cash used in operating activities
Depreciation and amortization 100,940 72,093 50,549
Unrealized foreign currency exchange rate losses 33,359 11,739 1,905
Loss on disposal of property and equipment 549 261 332
Stock-based compensation 60,376 50,812 43,184
Deferred income taxes (4,426) (17,584) (18,832)
Changes in reserves and allowances 40,391 31,350 13,945
Changes in operating assets and liabilities, net of effects of acquisitions:
Accounts receivable (191,876) (101,057) (35,960)
Inventories (278,524) (84,658) (156,900)
Prepaid expenses and other assets (76,476) (33,345) (19,049)
Accounts payable (22,583) 49,137 14,642
Accrued expenses and other liabilities 64,126 28,856 56,481
Income taxes payable and receivable (2,533) 3,387 7,443
Net cash provided by (used in) operating activities (44,104) 219,033 120,070
Cash flows from investing activities
Purchases of property and equipment (298,928) (140,528) (87,830)
Purchase of businesses, net of cash acquired (539,460) (10,924) (148,097)
Purchases of available-for-sale securities (103,144) — —
Sales of available-for-sale securities 96,610 — —
Purchases of other assets (2,553) (860) (475)
Change in loans receivable — — (1,700)
Net cash used in investing activities (847,475) (152,312) (238,102)
Cash flows from financing activities
Proceeds from revolving credit facility 500,000 — 100,000
Payments on revolving credit facility (225,000) (100,000) —
Proceeds from term loan 150,000 250,000 —
Payments on term loan (36,250) (13,750) —
Payments on long term debt (3,952) (4,972) (5,471)
Excess tax benefits from stock-based compensation arrangements 45,917 36,965 17,163
Proceeds from exercise of stock options and other stock issuances 10,310 15,776 15,103
Payments of debt financing costs (947) (1,713) —
Net cash provided by financing activities 440,078 182,306 126,795
Effect of exchange rate changes on cash and cash equivalents (11,822) (3,341) (3,115)
Net increase (decrease) in cash and cash equivalents (463,323) 245,686 5,648
Cash and cash equivalents
Beginning of period 593,175 347,489 341,841
End of period $ 129,852 $ 593,175 $ 347,489
Non-cash investing and financing activities
Increase in accrual for property and equipment $ 17,758 $ 4,922 $ 3,786
Non-cash acquisition of business — 11,233 —
Property and equipment acquired under build-to-suit leases 5,631 — —
Other supplemental information
Cash paid for income taxes 99,708 103,284 85,570
Cash paid for interest, net of capitalized interest 11,176 4,146 1,505
See accompanying notes.
55