Under Armour 2006 Annual Report Download - page 72
Download and view the complete annual report
Please find page 72 of the 2006 Under Armour annual report below. You can navigate through the pages in the report by either clicking on the pages listed below, or by using the keyword search tool below to find specific information within the annual report.-
 1
1 -
2
-
3
-
4
-
5
-
6
-
7
-
8
-
9
-
10
-
11
-
12
-
13
-
14
-
15
-
16
-
17
-
18
-
19
-
20
-
21
-
22
-
23
-
24
-
25
-
26
-
27
-
28
-
29
-
30
-
31
-
32
-
33
-
34
-
35
-
36
-
37
-
38
-
39
-
40
-
41
-
42
-
43
-
44
-
45
-
46
-
47
-
48
-
49
-
50
-
51
-
52
-
53
-
54
-
55
-
56
-
57
-
58
-
59
-
60
-
61
-
 62
62 -
 63
63 -
 64
64 -
 65
65 -
 66
66 -
 67
67 -
 68
68 -
 69
69 -
 70
70 -
 71
71 -
 72
72 -
 73
73 -
 74
74 -
 75
75 -
 76
76 -
 77
77 -
 78
78 -
 79
79 -
 80
80 -
 81
81 -
 82
82 -
83
-
84
 |
 |

Under Armour, Inc. and Subsidiaries
Notes to the Consolidated Financial Statements—(Continued)
(amounts in thousands, except per share and share amounts)
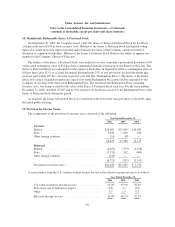
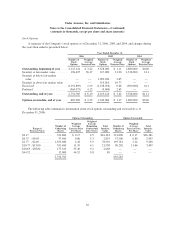
single operating and reportable segment. Although the Company operates within one reportable segment, it has
several different product categories within the segment, for which the revenues attributable to each product
category are as follows:
Year Ended December 31,
2006 2005 2004
Men’s .............................................. $255,681 $189,596 $151,962
Women’s ........................................... 85,695 53,500 28,659
Youth .............................................. 31,845 18,784 12,705
Apparel ......................................... 373,221 261,880 193,326
Footwear ............................................ 26,874 — —
Accessories .......................................... 14,897 9,409 7,548
Total net sales .................................... 414,992 271,289 200,874
License revenues ..................................... 15,697 9,764 4,307
Total net revenues ................................ $430,689 $281,053 $205,181
The table below summarizes product net revenues by geographic regions attributed by customer location:
Year Ended December 31,
2006 2005 2004
United States ........................................ $403,725 $266,048 $198,368
Canada ............................................. 16,485 9,502 4,055
Subtotal ......................................... 420,210 275,550 202,423
Other foreign countries ................................. 10,479 5,503 2,758
Total net revenues ................................ $430,689 $281,053 $205,181
During the last three years, substantially all of the Company’s long-lived assets were located in the United
States.
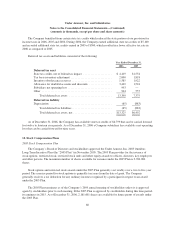
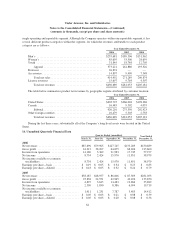
16. Unaudited Quarterly Financial Data
Quarter Ended (unaudited) Year Ended
December 31,March 31, June 30, September 30, December 31,
2006
Net revenues ............................ $87,696 $79,965 $127,745 $135,283 $430,689
Gross profit ............................. 44,312 38,207 64,675 68,406 215,600
Income from operations ................... 14,180 3,369 21,983 17,745 57,277
Net income ............................. 8,734 2,424 15,970 11,851 38,979
Net income available to common
stockholders ........................... 8,734 2,424 15,970 11,851 38,979
Earnings per share—basic .................. $ 0.19 $ 0.05 $ 0.34 $ 0.25 $ 0.83
Earnings per share—diluted ................ $ 0.18 $ 0.05 $ 0.32 $ 0.24 $ 0.79
2005
Net revenues ............................ $58,187 $48,957 $ 86,606 $ 87,303 $281,053
Gross profit ............................. 25,838 24,551 42,965 42,496 135,850
Income from operations ................... 4,897 3,645 14,483 12,864 35,889
Net income ............................. 2,509 1,830 8,386 6,994 19,719
Net income available to common
stockholders ........................... 1,911 1,231 7,787 3,483 14,412
Earnings per share—basic .................. $ 0.05 $ 0.03 $ 0.21 $ 0.08 $ 0.39
Earnings per share—diluted ................ $ 0.05 $ 0.03 $ 0.20 $ 0.08 $ 0.36
64