Under Armour 2006 Annual Report Download - page 33
Download and view the complete annual report
Please find page 33 of the 2006 Under Armour annual report below. You can navigate through the pages in the report by either clicking on the pages listed below, or by using the keyword search tool below to find specific information within the annual report.-
 1
1 -
2
-
3
-
4
-
5
-
6
-
7
-
8
-
9
-
10
-
11
-
12
-
13
-
14
-
15
-
16
-
17
-
18
-
19
-
20
-
21
-
22
-
 23
23 -
 24
24 -
 25
25 -
 26
26 -
 27
27 -
 28
28 -
 29
29 -
 30
30 -
 31
31 -
 32
32 -
 33
33 -
 34
34 -
 35
35 -
 36
36 -
 37
37 -
 38
38 -
 39
39 -
 40
40 -
 41
41 -
 42
42 -
 43
43 -
44
-
45
-
46
-
47
-
48
-
49
-
50
-
51
-
52
-
53
-
54
-
55
-
56
-
57
-
58
-
59
-
60
-
61
-
62
-
63
-
64
-
65
-
66
-
67
-
68
-
69
-
70
-
71
-
72
-
73
-
74
-
75
-
76
-
77
-
78
-
79
-
80
-
81
-
82
-
83
-
84
 |
 |
Although we believe these trends will facilitate our growth, we also face potential challenges that could
limit our ability to take advantage of these opportunities, including, among others, the risk that we may not be
able to manage our rapid growth effectively. In addition, we may not consistently be able to anticipate consumer
preferences and develop new products that meet changing preferences in a timely manner. Furthermore, our
industry is very competitive. Our profitability may decline if we experience increasing pressure on margins, if we
lose one or more of our key customers or if our competitors establish the brand loyalty of our current or potential
consumers. While we seek to diversify to minimize the risk of interruptions in the supply of raw materials for our
products and have what we believe is a diverse manufacturing base around the world, we may still be susceptible
to general economic changes such as increases in the costs of raw materials, including petroleum, which is a
significant component of many of our products, or other disruptions in the economy or in international trade. For
a more complete discussion of the risks facing our business, see “Risk Factors.”
General
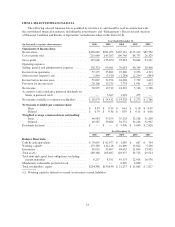
Net revenues comprise both net sales and license revenues. Net sales comprise our five primary product
categories, which are men’s, women’s and youth apparel, accessories and footwear products introduced in the
second and fourth quarters of 2006.
Cost of goods sold consists primarily of product costs, inbound freight and duty costs, handling costs to
make products floor-ready to customer specifications, and write downs for inventory obsolescence. In addition,
cost of goods sold includes overhead costs associated with our quick turn, Special Make-Up Shop and costs
relating to our Hong Kong and Guangzhou, China offices which help support manufacturing, quality assurance
and sourcing efforts. No cost of goods sold is associated with license revenues. We do not include our
distribution facility costs in the calculation of the cost of goods sold, but rather include these costs as a
component of our selling, general and administrative expenses. As a result, our gross profit may not be
comparable to that of other companies that include distribution facility costs in the calculation of their cost of
goods sold. We believe, however, that our distribution facility costs have not been of a sufficient magnitude to
materially affect our gross margin for purposes of comparison.
Our selling, general and administrative expenses consist of marketing costs, selling costs, payroll and
related costs (excluding those specifically related to marketing and selling) and other corporate costs. Our
marketing costs are an important driver of our growth and we strive to manage our marketing costs to be within
10-12% of net revenues on an annual basis. Marketing costs include payroll costs specific to marketing,
commercials, print ads, league and player sponsorships, amortization of footwear promotional rights and
depreciation expense specific to our in-store fixture program. Selling costs consist primarily of payroll costs
specific to selling and commissions paid to third parties. Payroll costs consist primarily of payroll and related
costs, excluding those specifically related to marketing and selling, and stock-based compensation expense.
Other corporate costs consist primarily of distribution and corporate facility costs, product creation costs and
other company-wide administrative expenses. In recent years, our selling, general and administrative expenses
have increased to support our growth and new sales initiatives.
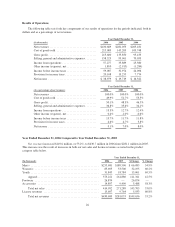
For 2006, we earned and recognized a new state income tax credit which reduced our effective tax rate to
34.0%. We expect our 2007 effective tax rate to approximate 40.5%.
25