Under Armour 2006 Annual Report Download - page 70
Download and view the complete annual report
Please find page 70 of the 2006 Under Armour annual report below. You can navigate through the pages in the report by either clicking on the pages listed below, or by using the keyword search tool below to find specific information within the annual report.-
 1
1 -
2
-
3
-
4
-
5
-
6
-
7
-
8
-
9
-
10
-
11
-
12
-
13
-
14
-
15
-
16
-
17
-
18
-
19
-
20
-
21
-
22
-
23
-
24
-
25
-
26
-
27
-
28
-
29
-
30
-
31
-
32
-
33
-
34
-
35
-
36
-
37
-
38
-
39
-
40
-
41
-
42
-
43
-
44
-
45
-
46
-
47
-
48
-
49
-
50
-
51
-
52
-
53
-
54
-
55
-
56
-
57
-
58
-
59
-
 60
60 -
 61
61 -
 62
62 -
 63
63 -
 64
64 -
 65
65 -
 66
66 -
 67
67 -
 68
68 -
 69
69 -
 70
70 -
 71
71 -
 72
72 -
 73
73 -
 74
74 -
 75
75 -
 76
76 -
 77
77 -
 78
78 -
 79
79 -
 80
80 -
81
-
82
-
83
-
84
 |
 |

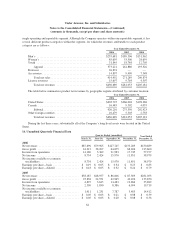
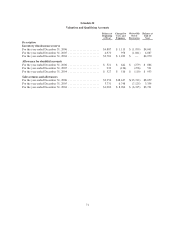
Under Armour, Inc. and Subsidiaries
Notes to the Consolidated Financial Statements—(Continued)
(amounts in thousands, except per share and share amounts)
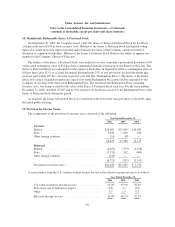
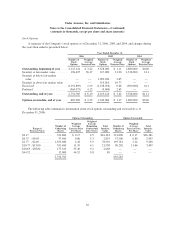
Stock Options
A summary of the Company’s stock options as of December 31, 2006, 2005, and 2004, and changes during
the years then ended is presented below:
Year Ended December 31,
2006 2005 2004
Number of
Stock
Options
Weighted
Average
Exercise Price
Number of
Stock
Options
Weighted
Average
Exercise Price
Number of
Stock
Options
Weighted
Average
Exercise Price
Outstanding, beginning of year .... 4,215,124 $ 3.42 3,528,000 $ 1.11 2,880,000 $0.40
Granted, at fair market value ....... 196,425 36.17 217,000 13.00 1,338,000 2.11
Granted, at below fair market
value ........................ — — 1,099,030 2.65 — —
Granted, at above fair market value . . — — 513,010 10.77 — —
Exercised ....................... (1,291,809) 2.29 (1,138,916) 0.66 (690,000) 0.11
Forfeited ....................... (364,975) 4.12 (3,000) 2.65 — —
Outstanding, end of year ......... 2,754,765 $ 6.19 4,215,124 $ 3.42 3,528,000 $1.11
Options exercisable, end of year . . . 665,283 $ 2.39 1,243,084 $ 1.17 1,689,000 $0.40
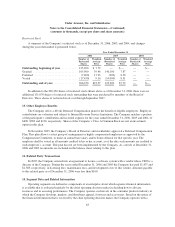
The following table summarizes information about stock options outstanding and exercisable as of
December 31, 2006:
Options Outstanding Options Exercisable
Range of
Exercise Prices
Number of
Underlying
Shares
Weighted
Average
Exercise Price
Per Share
Weighted
Average
Remaining
Contractual
Life (Years)
Total
Intrinsic
Value
Number of
Underlying
Shares
Weighted
Average
Exercise Price
Per Share
Total
Intrinsic
Value
$0.17 ................ 321,800 $ 0.17 4.5 $16,181 321,800 $ 0.17 $16,181
$0.75 - $0.83 ......... 57,500 0.80 5.3 2,855 57,500 0.80 2,855
$1.77 - $2.65 ......... 1,631,680 2.28 3.9 78,592 195,781 2.24 9,438
$10.77 - $13.00 ........ 551,460 11.39 4.1 21,538 90,202 11.66 3,499
$28.65 - $38.84 ........ 177,325 35.40 9.2 2,668 — — —
$44.52 ............... 15,000 44.52 9.8 89 — — —
2,754,765 665,283
62