Under Armour 2006 Annual Report Download - page 31
Download and view the complete annual report
Please find page 31 of the 2006 Under Armour annual report below. You can navigate through the pages in the report by either clicking on the pages listed below, or by using the keyword search tool below to find specific information within the annual report.-
 1
1 -
2
-
3
-
4
-
5
-
6
-
7
-
8
-
9
-
10
-
11
-
12
-
13
-
14
-
15
-
16
-
17
-
18
-
19
-
20
-
 21
21 -
 22
22 -
 23
23 -
 24
24 -
 25
25 -
 26
26 -
 27
27 -
 28
28 -
 29
29 -
 30
30 -
 31
31 -
 32
32 -
 33
33 -
 34
34 -
 35
35 -
 36
36 -
 37
37 -
 38
38 -
 39
39 -
 40
40 -
 41
41 -
42
-
43
-
44
-
45
-
46
-
47
-
48
-
49
-
50
-
51
-
52
-
53
-
54
-
55
-
56
-
57
-
58
-
59
-
60
-
61
-
62
-
63
-
64
-
65
-
66
-
67
-
68
-
69
-
70
-
71
-
72
-
73
-
74
-
75
-
76
-
77
-
78
-
79
-
80
-
81
-
82
-
83
-
84
 |
 |

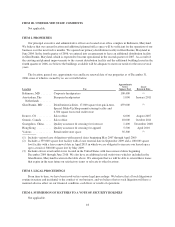
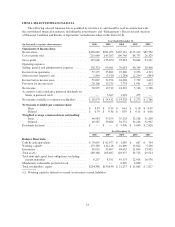
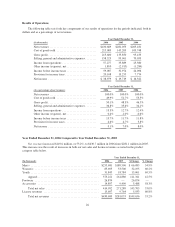
ITEM 6. SELECTED FINANCIAL DATA
The following selected financial data is qualified by reference to, and should be read in conjunction with,
the consolidated financial statements, including the notes thereto, and “Management’s Discussion and Analysis
of Financial Condition and Results of Operations” included elsewhere in this Form 10-K.
Year Ended December 31,
(In thousands, except per share amounts) 2006 2005 2004 2003 2002
Statements of Income data:
Net revenues .................................. $430,689 $281,053 $205,181 $115,419 $49,550
Cost of goods sold ............................. 215,089 145,203 109,748 64,757 26,329
Gross profit ................................... 215,600 135,850 95,433 50,662 23,221
Operating expenses
Selling, general and administrative expenses ......... 158,323 99,961 70,053 40,709 18,908
Income from operations ......................... 57,277 35,889 25,380 9,953 4,313
Other income (expense), net ...................... 1,810 (2,915) (1,284) (2,214) (894)
Income before income taxes ...................... 59,087 32,974 24,096 7,739 3,419
Provision for income taxes ....................... 20,108 13,255 7,774 1,991 653
Net income ................................... 38,979 19,719 16,322 5,748 2,766
Accretion of and cumulative preferred dividends on
Series A preferred stock ....................... — 5,307 1,994 475 —
Net income available to common stockholders ....... $ 38,979 $ 14,412 $ 14,328 $ 5,273 $ 2,766
Net income available per common share:
Basic .................................... $ 0.83 $ 0.39 $ 0.41 $ 0.16 $ 0.09
Diluted .................................. $ 0.79 $ 0.36 $ 0.39 $ 0.15 $ 0.08
Weighted average common shares outstanding:
Basic .................................... 46,983 37,199 35,124 32,106 31,200
Diluted .................................. 49,587 39,686 36,774 34,146 32,967
Dividends declared ............................. $ — $ — $ 5,000 $ 3,640 $ 2,826
As of December 31,
2006 2005 2004 2003 2002
Balance Sheet data:
Cash & cash equivalents ........................ $ 70,655 $ 62,977 $ 1,085 $ 667 $ 794
Working capital(1) .............................. 173,389 134,118 16,690 13,822 5,296
Inventories ................................... 81,031 53,607 48,055 21,849 13,905
Total assets ................................... 289,368 203,687 110,977 54,725 29,524
Total debt and capital lease obligations, including
current maturities ............................ 6,257 8,391 45,133 22,018 16,976
Mandatorily redeemable preferred stock ............ — — 6,692 4,698 —
Total stockholders’ equity ....................... $214,388 $150,830 $ 21,237 $ 11,865 $ 2,827
(1) Working capital is defined as current assets minus current liabilities.
23