Under Armour 2006 Annual Report Download - page 4
Download and view the complete annual report
Please find page 4 of the 2006 Under Armour annual report below. You can navigate through the pages in the report by either clicking on the pages listed below, or by using the keyword search tool below to find specific information within the annual report.-
 1
1 -
 2
2 -
 3
3 -
 4
4 -
 5
5 -
 6
6 -
 7
7 -
 8
8 -
 9
9 -
 10
10 -
 11
11 -
 12
12 -
 13
13 -
 14
14 -
 15
15 -
16
-
17
-
18
-
19
-
20
-
21
-
22
-
23
-
24
-
25
-
26
-
27
-
28
-
29
-
30
-
31
-
32
-
33
-
34
-
35
-
36
-
37
-
38
-
39
-
40
-
41
-
42
-
43
-
44
-
45
-
46
-
47
-
48
-
49
-
50
-
51
-
52
-
53
-
54
-
55
-
56
-
57
-
58
-
59
-
60
-
61
-
62
-
63
-
64
-
65
-
66
-
67
-
68
-
69
-
70
-
71
-
72
-
73
-
74
-
75
-
76
-
77
-
78
-
79
-
80
-
81
-
82
-
83
-
84
 |
 |

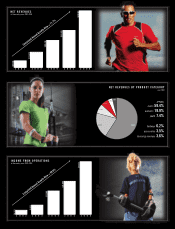
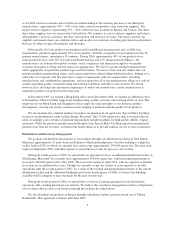
NET REVENUES
in thousands; years 2002-2006
NET REVENUES BY PRODUCT CATEGORY
year 2006
APPAREL
men’s 59.4%
women’s 19.9%
youth 7.4%
footwear 6.2%
accessories 3.5%
licensing revenues 3.6%
2002 2003 2004 2005 2006
$49,550
$115,419
$205,181
$281,053
$430,689
59.4%
19.9%
7.4%
6.2%
3.5% 3.6%
Compound Annual Growth Rate = 71.7%
$4,313
$9,953
$25,380
$35,889
$57,277
2002 2003 2004 2005 2006
INCOME FROM OPERATIONS
in thousands; years 2002-2006
Compound Annual Growth Rate = 90.9%