Under Armour 2006 Annual Report Download - page 35
Download and view the complete annual report
Please find page 35 of the 2006 Under Armour annual report below. You can navigate through the pages in the report by either clicking on the pages listed below, or by using the keyword search tool below to find specific information within the annual report.-
 1
1 -
2
-
3
-
4
-
5
-
6
-
7
-
8
-
9
-
10
-
11
-
12
-
13
-
14
-
15
-
16
-
17
-
18
-
19
-
20
-
21
-
22
-
23
-
24
-
 25
25 -
 26
26 -
 27
27 -
 28
28 -
 29
29 -
 30
30 -
 31
31 -
 32
32 -
 33
33 -
 34
34 -
 35
35 -
 36
36 -
 37
37 -
 38
38 -
 39
39 -
 40
40 -
 41
41 -
 42
42 -
 43
43 -
 44
44 -
 45
45 -
46
-
47
-
48
-
49
-
50
-
51
-
52
-
53
-
54
-
55
-
56
-
57
-
58
-
59
-
60
-
61
-
62
-
63
-
64
-
65
-
66
-
67
-
68
-
69
-
70
-
71
-
72
-
73
-
74
-
75
-
76
-
77
-
78
-
79
-
80
-
81
-
82
-
83
-
84
 |
 |
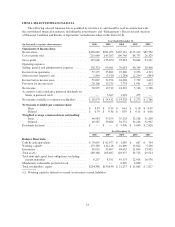
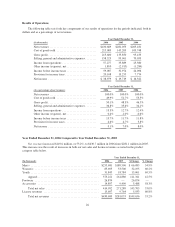
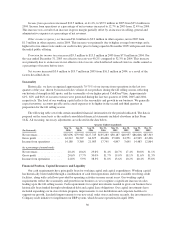
Net sales increased $143.7 million, or 53.0%, to $415.0 million for the year ended December 31, 2006 from
$271.3 million during the same period in 2005 as noted in the table above. The increase in net sales primarily reflects:
• $26.9 million of footwear product sales, primarily football cleats introduced in the second quarter of
2006, and baseball cleats introduced in the fourth quarter of 2006;
• continued unit volume growth of our existing products, such as ColdGear®compression products,
primarily sold to existing retail customers due to additional retail stores and expanded floor space;
• growth in the average selling price of apparel products within all categories;
• increased women’s and youth market penetration by leveraging current customer relationships; and
• product introductions subsequent to December 31, 2005 within all product categories, most
significantly in our compression and training products.
License revenues increased $5.9 million, or 60.8%, to $15.7 million for the year ended December 31, 2006
from $9.8 million during the same period in 2005. This increase in license revenues was a result of increased
sales by our licensees due to increased distribution, continued unit volume growth, new product offerings and
new licensing agreements, which now includes distribution of products to college bookstores and golf pro shops.
Gross profit increased $79.7 million to $215.6 million in 2006 from $135.9 million in 2005. Gross profit as
a percentage of net revenues, or gross margin, increased approximately 180 basis points to 50.1% in 2006 from
48.3% in 2005. This increase in gross margin was primarily driven by the following:
• lower product costs as a result of variations in product mix and greater supplier discounts for increased
volume and lower cost sourcing arrangements, accounting for an approximate 170 basis point increase;
• decreased close-out sales in the 2006 period compared to the 2005 period, accounting for an
approximate 70 basis point increase;
• lower customer incentives as a percentage of net revenues, primarily driven by changes to certain
customer agreements which decreased discounts offsetting revenue while increasing targeted customer
marketing expenditures recorded in selling, general and administrative expenses, accounting for an
approximate 70 basis point increase;
• increased direct to consumer higher margin sales, accounting for an approximate 50 basis point
increase; partially offset by
• increased sales returns and allowances, accounting for an approximate 70 basis point decrease; and
• lower gross margin attributable to the introduction of our footwear products which have lower profit
margins than our current apparel products, accounting for an approximate 120 basis point decrease.
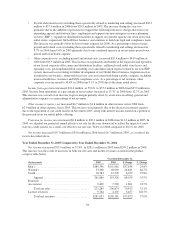
Selling, general and administrative expenses increased $58.3 million, or 58.4%, to $158.3 million in 2006
from $100.0 million in 2005. As a percentage of net revenues, selling, general and administrative expenses
increased to 36.8% in 2006 from 35.6% in 2005. These changes were primarily attributable to the following:
• Marketing costs increased $17.8 million to $48.3 million in 2006 from $30.5 million in 2005 primarily
due to the National Football League (“NFL”) Agreement and sponsorship of new teams on the
collegiate level, increased in-store marketing signage and fixtures, film and print advertising
campaigns, increased costs to support the development of our Global Direct business (website and
catalog sales), and marketing salaries. As a percentage of net revenues, marketing costs increased to
11.2% in 2006 from 10.8% in 2005 due primarily to the items described above.
• Selling costs increased $10.6 million to $27.7 million in 2006 from $17.1 million in 2005. This
increase was primarily due to the continued investment in our international growth initiatives,
including the establishment of our European business, increased headcount in our sales force, and
additional trade show and sales meeting expenditures. As a percentage of net revenues, selling costs
increased to 6.4% in 2006 from 6.1% in 2005 primarily due to our international growth initiatives.
27