Ulta 2008 Annual Report Download - page 35
Download and view the complete annual report
Please find page 35 of the 2008 Ulta annual report below. You can navigate through the pages in the report by either clicking on the pages listed below, or by using the keyword search tool below to find specific information within the annual report.-
 1
1 -
2
-
3
-
4
-
5
-
6
-
7
-
8
-
9
-
10
-
11
-
12
-
13
-
14
-
15
-
16
-
17
-
18
-
19
-
20
-
21
-
22
-
23
-
24
-
 25
25 -
 26
26 -
 27
27 -
 28
28 -
 29
29 -
 30
30 -
 31
31 -
 32
32 -
 33
33 -
 34
34 -
 35
35 -
 36
36 -
 37
37 -
 38
38 -
 39
39 -
 40
40 -
 41
41 -
 42
42 -
 43
43 -
 44
44 -
 45
45 -
46
-
47
-
48
-
49
-
50
-
51
-
52
-
53
-
54
-
55
-
56
-
57
-
58
-
59
-
60
-
61
-
62
-
63
-
64
-
65
-
66
-
67
-
68
-
69
-
70
-
71
-
72
-
73
-
74
-
75
-
76
-
77
-
78
-
79
-
80
-
81
-
82
-
83
-
84
 |
 |

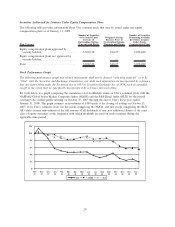
Securities Authorized for Issuance Under Equity Compensation Plans
The following table provides information about Ulta common stock that may be issued under our equity
compensation plans as of January 31, 2009.
Plan Category
Number of Securities
to be Issued Upon
Exercise of
Outstanding Options,
Warrants and Rights
Weighted-Average
Exercise Price of
Outstanding Options,
Warrants and Rights
Number of Securities
Remaining Available
for Future Issuance
Under Equity
Compensation Plans
Equity compensation plans approved by
security holders ...................... 5,300,338 $10.27 3,038,480
Equity compensation plans not approved by
security holders ...................... — — —
Total ............................... 5,300,338 $10.27 3,038,480
Stock Performance Graph
The following performance graph and related information shall not be deemed “soliciting material” or to be
“filed” with the Securities and Exchange Commission, nor shall such information be incorporated by reference
into any future filing under the Securities Act of 1933 or Securities Exchange Act of 1934, each as amended,
except to the extent that we specifically incorporate it by reference into such filing.
Set forth below is a graph comparing the cumulative total stockholder return on Ulta’s common stock with the
NASDAQ Global Select Market Composite Index (NQGS) and the S&P Retail Index (RLX) for the period
covering Ulta’s initial public offering on October 25, 2007 through the end of Ulta’s fiscal year ended
January 31, 2009. The graph assumes an investment of $100 made at the closing of trading on October 25,
2007, in (i) Ulta’s common stock, (ii) the stocks comprising the NQGS, and (iii) stocks comprising the RLX.
All values assume reinvestment of the full amount of all dividends, if any, into additional shares of the same
class of equity securities at the frequency with which dividends are paid on such securities during the
applicable time period.
$120
$100
$80
$60
$40
$20
$0
Ulta NQGS RLX
Jan-
09
Dec-
08
Nov-
08
Oct-
08
Sep-
08
Aug-
08
Jul-
08
Jun-
08
May-
08
Apr-
08
Mar-
08
Feb-
08
Jan-
08
Dec-
07
Nov-
07
Oct-
07
29