Ulta 2008 Annual Report Download - page 3
Download and view the complete annual report
Please find page 3 of the 2008 Ulta annual report below. You can navigate through the pages in the report by either clicking on the pages listed below, or by using the keyword search tool below to find specific information within the annual report.-
 1
1 -
 2
2 -
 3
3 -
 4
4 -
 5
5 -
 6
6 -
 7
7 -
 8
8 -
 9
9 -
 10
10 -
 11
11 -
 12
12 -
 13
13 -
 14
14 -
15
-
16
-
17
-
18
-
19
-
20
-
21
-
22
-
23
-
24
-
25
-
26
-
27
-
28
-
29
-
30
-
31
-
32
-
33
-
34
-
35
-
36
-
37
-
38
-
39
-
40
-
41
-
42
-
43
-
44
-
45
-
46
-
47
-
48
-
49
-
50
-
51
-
52
-
53
-
54
-
55
-
56
-
57
-
58
-
59
-
60
-
61
-
62
-
63
-
64
-
65
-
66
-
67
-
68
-
69
-
70
-
71
-
72
-
73
-
74
-
75
-
76
-
77
-
78
-
79
-
80
-
81
-
82
-
83
-
84
 |
 |
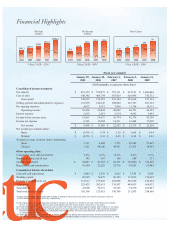
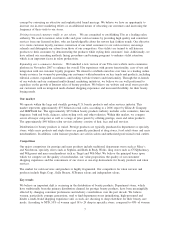
Financial Highlights
5-Year CAGR – 21%* 5-Year CAGR – 38%* 5-Year CAGR – 20%*
Net Sales
(in Millions)
Net Income
(in Millions)
Store Count
20082007200620052004 20082007200620052004 20082007200620052004
$1,084.6
19%18%
$912.1
$755.1
$579.1
$491.2 $9.5
$16.0
$22.5 $25.3 $25.3
142 167 196
249
311
21%
30%
16% 86% 69% 41% 12% 0%
13% 18% 17%
27% 25%
Consolidated income statement:
Net sales(2) $ 491,152 $ 579,075 $ 755,113 $ 912,141 $ 1,084,646
Cost of sales 346,585 404,794 519,929 628,495 756,712
Gross profit 144,567 174,281 235,184 283,646 327,934
Selling, general and administrative expenses 121,999 140,145 188,000 225,167 267,322
Pre-opening expenses 4,072 4,712 7,096 11,758 14,311
Operating income 18,496 29,424 40,088 46,721 46,301
Interest expense 2,835 2,951 3,314 4,542 3,943
Income before income taxes 15,661 26,473 36,774 42,179 42,358
Income tax expense 6,201 10,504 14,231 16,844 17,090
Net income $ 9,460 $ 15,969 $ 22,543 $ 25,335 $ 25,268
Net income per common share:
Basic $ (0.70) $ 0.74 $ 1.38 $ 0.69 $ 0.44
Diluted $ (0.70) $ 0.33 $ 0.45 $ 0.48 $ 0.43
Weighted average common shares outstanding:
Basic 3,181 4,094 5,771 20,383 57,425
Diluted 3,181 48,196 49,921 53,293 58,967
Other operating data:
Comparable store sales increase(3) 8.0% 8.3% 14.5% 6.4% 0.2%
Number of stores end of year 142 167 196 249 311
Capital expenditures $ 34,807 $ 41,607 $ 62,331 $ 101,866 $ 110,863
Depreciation and amortization 18,304 22,285 29,736 39,503 51,445
Consolidated balance sheet data:
Cash and cash equivalents $ 3,004 $ 2,839 $ 3,645 $ 3,789 $ 3,638
Working capital 69,955 76,473 88,105 117,039 159,695
Property and equipment, net 114,912 133,003 162,080 236,389 292,224
Total assets 253,425 282,615 338,597 469,413 568,932
Total debt(4) 47,008 50,173 55,529 74,770 106,047
Total stockholders’ equity 105,308 123,015 148,760 211,503 244,968
Fiscal year ended(1)
January 29, January 28, February 3, February 2, January 31,
2005 2006 2007 2008 2009
(In thousands, except per share data)
(1) Our fiscal year-end is the Saturday closest to January 31 based on a 52/53-week year. Each fiscal year consists
of four 13-week quarters, with an extra week added onto the fourth quarter every five or six years.
(2) Fiscal 2006 was a 53-week operating year and the 53rd week represented approximately $16.4 million in net sales.
(3) Comparable store sales increase reflects sales for stores beginning on the first day of the 14th month of operation.
Remodeled stores are included in comparable store sales unless the store was closed for a portion of the current
or comparable prior year.
(4) Total debt includes approximately $4.8 million related to the Series III preferred stock, which is presented between
the liabilities section and the equity section of our consolidated balance sheet for all years prior to February 2, 2008.
* 5-Year Compound Annual Growth Rate (CAGR) is based on fiscal 2003 net sales, net income and store count of
$423.9 million, $5.1 million and 126, respectively.