TJ Maxx 1999 Annual Report Download - page 4
Download and view the complete annual report
Please find page 4 of the 1999 TJ Maxx annual report below. You can navigate through the pages in the report by either clicking on the pages listed below, or by using the keyword search tool below to find specific information within the annual report.-
 1
1 -
 2
2 -
 3
3 -
 4
4 -
 5
5 -
 6
6 -
 7
7 -
 8
8 -
 9
9 -
 10
10 -
 11
11 -
 12
12 -
 13
13 -
 14
14 -
 15
15 -
16
-
17
-
18
-
19
-
20
-
21
-
22
-
23
-
24
-
25
-
26
-
27
-
28
-
29
-
30
-
31
-
32
 |
 |

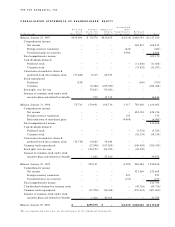
T h e T J X C o m p a n i e s , I n c .
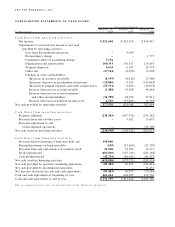
C O N S O L I D A T E D S T A T E M E N T S O F C A S H F L O W S
Fi scal Ye a r E n d e d
Ja n u a ry 2 9 , Ja n u a ry 3 0, Ja nu a ry 3 1 ,
I n Th o u s a n d s 2 0 0 0 1 9 9 9 1 9 9 8
( 5 3 w e e k s )
C a sh f l ow s f ro m o pe ra t in g a c t iv i t i e s:
Net income $ 521,668 $ 424,154 $ 304,815
Adjustments to reconcile net income to net cash
provided by operating activities:
Loss from discontinued operations –9,048 –
Extraordinary charge –– 1,777
Cumulative effect of accounting change 5,154 – –
Depreciation and amortization 160,393 136,531 124,891
Property disposals 4,624 6,037 18,778
Other, net (27,744) (6,296) (3,928)
Changes in assets and liabilities:
(Increase) in accounts receivable (8,199) (6,610) (3,460)
(Increase) decrease in merchandise inventories (28,886) 4,102 (130,665)
( I n c rease) in prepaid expenses and other current assets (15,532) (1,091) (10,978)
Increase (decrease) in accounts payable (1,488) 34,368 48,846
Increase (decrease) in accrued expenses
and other current liabilities (34,789) 48,670 37,211
Increase (decrease) in deferred income taxes 2,769 (19,965) (3,793)
Net cash provided by operating activities 577,970 628,948 383,494
C a sh f l o w s f ro m i n v e s t i n g a ct i v i t i e s :
Property additions (238,569) (207,742) (192,382)
Proceeds from sale of other assets –9,421 15,697
Proceeds adjustment to sale
of discontinued operations –– (33,190)
Net cash (used in) investing activities (238,569) (198,321) (209,875)
C a sh f low s f ro m f in a n ci n g a ct i v it i e s:
Proceeds from borrowings of long-term debt, net 198,060 – –
Principal payments on long-term debt (695) (23,360) (27,179)
Proceeds from sale and issuance of common stock 21,048 27,763 15,471
Stock repurchased (604,560) (337,744) (245,198)
Cash dividends paid (42,739) (40,411) (41,527)
Net cash (used in) financing activities (428,886) (373,752) (298,433)
Net cash provided by (used in) continuing operations (89,485) 56,875 (124,814)
Net cash provided by discontinued operations –– 54,451
Net increase (decrease) in cash and cash equivalents (89,485) 56,875 (70,363)
Cash and cash equivalents at beginning of year 461,244 404,369 474,732
Cash and cash equivalents at end of year $ 371,759 $ 461,244 $ 404,369
Th e a cco m p a n y in g n o t e s a re a n in t e g ral p a rt o f t h e fin a n c ial st a t e m e n t s.