TJ Maxx 1999 Annual Report Download - page 15
Download and view the complete annual report
Please find page 15 of the 1999 TJ Maxx annual report below. You can navigate through the pages in the report by either clicking on the pages listed below, or by using the keyword search tool below to find specific information within the annual report.-
 1
1 -
2
-
3
-
4
-
 5
5 -
 6
6 -
 7
7 -
 8
8 -
 9
9 -
 10
10 -
 11
11 -
 12
12 -
 13
13 -
 14
14 -
 15
15 -
 16
16 -
 17
17 -
 18
18 -
 19
19 -
 20
20 -
 21
21 -
 22
22 -
 23
23 -
 24
24 -
 25
25 -
26
-
27
-
28
-
29
-
30
-
31
-
32
 |
 |

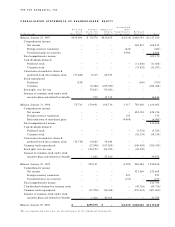
E arn in gs Pe r Sh a re : The following schedule presents the calculation of basic and diluted earnings per share
for income from continuing operations:
Fi scal Ye a r E n d e d
Ja n u a ry 2 9 , Ja n u a ry 3 0, Ja nu a ry 3 1 ,
Do ll a rs I n Th ou s a n d s E x cep t Pe r S hare A m o u n t s 2 0 0 0 1 9 9 9 1 9 9 8
(5 3 w e e k s )
Basic earnings per share:
Income from continuing operations befo re ex t ra o rd i n a ry item
and cumulat i ve effect of accounting change $526,822 $433,202 $306,592
Less preferred stock dividends –3,523 11,668
Income from continuing operations before extraordinary
item and cumulative effect of accounting change
available to common shareholders $526,822 $429,679 $294,924
Weighted average common stock outstanding
for basic earnings per share 314,577,145 318,073,081 321,474,046
Basic earnings per share $ 1.67 $ 1.35 $ .92
Diluted earnings per share:
Income from continuing operations before extraordinary
item and cumulative effect of accounting change
available to common shareholders $526,822 $429,679 $294,924
Add preferred stock dividends –3,523 11,668
Income from continuing operations befo re ex t ra o rd i n a ry item
and cumulat i ve effect of accounting change for diluted
e a r n i n g s per share calculation $526,822 $433,202 $306,592
Weighted average common stock outstanding
for basic earnings per share 314,577,145 318,073,081 321,474,046
Assumed conversion of:
Convertible preferred stock –10,914,354 24,032,172
Stock options and awards 3,213,619 5,660,515 4,105,966
Weighted average common shares for
diluted earnings per share calculation 317,790,764 334,647,950 349,612,184
Diluted earnings per share $ 1.66 $ 1.29 $ .88
The weighted average common shares for diluted earnings per share calculation at January 29, 2000 excludes
the incremental effect related to outstanding stock options whose exercise price is in excess of the average price
of the Company’s stock of $28.50 for the fiscal year.These options are excluded due to their antidilutive effect
at January 29, 2000.
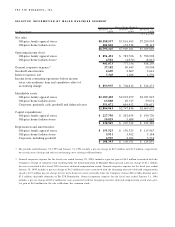
H . I n co m e Ta xe s
The provision for income taxes includes the following: Fi scal Ye a r E n d e d
Ja n u a ry 2 9 , Ja n u a ry 3 0, Ja nu a ry 3 1 ,
I n Th o u s a n d s 2 0 0 0 1 9 9 9 1 9 9 8
( 5 3 w e e k s )
Current:
Federal $255,277 $231,811 $172,026
State 49,836 45,117 39,200
Foreign 20,212 13,784 8,117
Deferred:
Federal 3,885 (13,084) (3,432)
State 1,984 (2,306) (326)
Foreign (4,079) (4,512) 94
Provision for income taxes $327,115 $270,810 $215,679