TJ Maxx 1999 Annual Report Download - page 1
Download and view the complete annual report
Please find page 1 of the 1999 TJ Maxx annual report below. You can navigate through the pages in the report by either clicking on the pages listed below, or by using the keyword search tool below to find specific information within the annual report.-
 1
1 -
 2
2 -
 3
3 -
 4
4 -
 5
5 -
 6
6 -
 7
7 -
 8
8 -
 9
9 -
 10
10 -
 11
11 -
 12
12 -
13
-
14
-
15
-
16
-
17
-
18
-
19
-
20
-
21
-
22
-
23
-
24
-
25
-
26
-
27
-
28
-
29
-
30
-
31
-
32
 |
 |

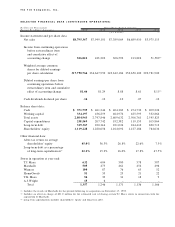
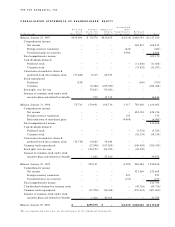
S E L E C T E D F I N A N C I A L D A T A ( C O N T I N U I N G O P E R A T I O N S )
Do llars I n Th ousa nd s Fisca l Ye ar E n de d Ja n u a r y
E x ce pt Per S h a re A m o u n t s 2 0 0 0 1 9 9 9 1 9 9 8 1 9 9 7 1 9 9 6
( 5 3 w e e k s ) (1)
Income statement and per share data:
Net sales $8,795,347 $7,949,101 $7,389,069 $6,689,410 $3,975,115
Income from continuing operations
before extraordinary item
and cumulative effect of
accounting change 526,822 433,202 306,592 213,826 51,589(2)
Weighted average common
shares for diluted earnings
per share calculation 317,790,764 334,647,950 349,612,184 350,650,100 290,781,900
Diluted earnings per share from
continuing operations before
ex t ra o rd i n a ry item and cumulat i ve
effect of accounting change $1.66 $1.29 $.88 $.61 $.15(2)
Cash dividends declared per share .14 .12 .10 .07 .12
Balance sheet data:
Cash $ 371,759 $ 461,244 $ 404,369 $ 474,732 $ 209,226
Working capital 334,197 436,259 464,974 425,595 332,864
Total assets 2,804,963 2,747,846 2,609,632 2,506,761 2,545,825
Capital expenditures 238,569 207,742 192,382 119,153 105,864
Long-term debt 319,367 220,344 221,024 244,410 690,713
Shareholders’ equity 1,119,228 1,220,656 1,164,092 1,127,186 764,634
Other financial data:
After-tax return on average
shareholders’ equity 45.0% 36.3% 26.8% 22.6% 7.5%
Long-term debt as a percentage
of long-term capitalization(3) 22.2% 15.3% 16.0% 17.8% 47.5%
Stores in operation at year-end:
T.J. Maxx 632 604 580 578 587
Marshalls 505 475 461 454 496
Winners 100 87 76 65 52
HomeGoods 51 35 23 21 22
T.K. Maxx 54 39 31 18 9
A.J.Wright 15 6 – – –
Total 1,357 1,246 1,171 1,136 1,166
( 1 ) Includes the results of Marshalls for the periods fo l l owing its acquisition on November 17, 1 9 9 5 .
( 2 ) Includes an after-tax charge of $21.0 million for the estimated cost of closing certain T. J. Maxx stores in connection with the
acquisition of Mars h a l l s .
( 3 ) Long-term cap i t a l i z ation includes share h o l d e rs’ equity and long-term deb t .
T h e T J X C o m p a n i e s , I n c .