Square Enix 2015 Annual Report Download - page 66
Download and view the complete annual report
Please find page 66 of the 2015 Square Enix annual report below. You can navigate through the pages in the report by either clicking on the pages listed below, or by using the keyword search tool below to find specific information within the annual report.-
 1
1 -
2
-
3
-
4
-
5
-
6
-
7
-
8
-
9
-
10
-
11
-
12
-
13
-
14
-
15
-
16
-
17
-
18
-
19
-
20
-
21
-
22
-
23
-
24
-
25
-
26
-
27
-
28
-
29
-
30
-
31
-
32
-
33
-
34
-
35
-
36
-
37
-
38
-
39
-
40
-
41
-
42
-
43
-
44
-
45
-
46
-
47
-
48
-
49
-
50
-
51
-
52
-
53
-
54
-
55
-
 56
56 -
 57
57 -
 58
58 -
 59
59 -
 60
60 -
 61
61 -
 62
62 -
 63
63 -
 64
64 -
 65
65 -
 66
66 -
 67
67 -
 68
68 -
 69
69 -
 70
70 -
 71
71 -
 72
72 -
 73
73 -
 74
74
 |
 |

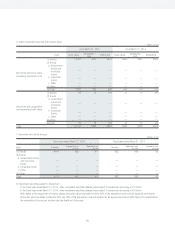
64
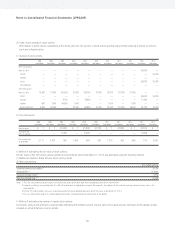
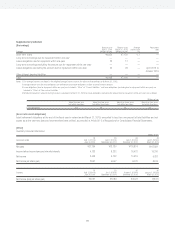
Segment Information
[Segment Information]
■ Year ended March 31, 2015
1. Outline of reporting segments
The Company’s reporting segments are business units for which abstracted financial data is available and periodically reviewed by the Board of Directors to
determine resource allocation and to evaluate business performance.
In a rapidly evolving business environment, the Company seeks to provide high-quality entertainment content and services through a variety of environments to
match customer lifestyles.
Accordingly, the Company maintains four business segments, each dedicated to a particular entertainment content and service format: (1) the “Digital
Entertainment” segment, for interactive digital content for game consoles (including handheld game machines), personal computers and smartphones; (2) the
“Amusement” segment, for amusement facility operation as well as the sale and rental of arcade game machines; (3) the “Publication” segment, for publication of
comic books, game strategy books and comic magazines; and (4) the “Merchandising” segment, for planning, production, distribution and licensing of derivative
products. These are the Company’s reporting segments.
2. Calculating reporting segment sales, income (loss), assets and other items
Accounting treatment methods applied to financial results of reporting segments are the same as those used in the preparation of the Company’s consolidated
financial statements. Reporting segment income corresponds to operating income. Intersegment sales are based on prevailing prices in the market for the content
and/or services provided.
3. Information on sales, income (loss), assets and other items by reporting segment
Millions of yen
Reporting segments Adjustment
(Note 1)
Consolidated total
(Note 2)
Digital
Entertainment Amusement Publication Merchandising Total
Net sales
(1) Sales to outside customers ¥111,896 ¥40,715 ¥11,509 ¥3,769 ¥167,891 ¥ — ¥167,891
(2) Intersegment sales 30 0 37 227 295 (295) —
Total 111,926 40,715 11,547 3,997 168,187 (295) 167,891
Segment operating income ¥ 17,276 ¥ 3,615 ¥ 3,241 ¥1,161 ¥ 25,294 ¥ (8,867) ¥ 16,426
Segment assets ¥ 71,221 ¥15,367 ¥ 4,026 ¥ 982 ¥ 91,598 ¥120,340 ¥211,938
Other items
Depreciation and amortization 3,579 2,722 87 28 6,418 516 6,934
Increases in property and equipment
and intangible assets 2,392 2,510 17 9 4,929 1,118 6,048
Notes: 1 (1) Segment adjustments (¥8,867 million) include unallocated corporate operating expenses (¥8,907 million).
(2) Unallocated assets amounting to ¥120,594 million are included in the ¥120,340 million adjustment to segment assets. Most of this amount comprises funds for
management of surplus funds (cash and deposits).
(3) The ¥516 million adjustment to depreciation and amortization is associated with unallocated assets that do not belong to any reporting segment.
(4) The ¥1,118 million adjustment to increases in property and equipment and intangible assets is associated with unallocated assets that do not belong to any reporting
segment.
2 Segment operating income corresponds to operating income on the Consolidated Statement of Income.
Notes to Consolidated Financial Statements (JPNGAAP)