Square Enix 2015 Annual Report Download - page 33
Download and view the complete annual report
Please find page 33 of the 2015 Square Enix annual report below. You can navigate through the pages in the report by either clicking on the pages listed below, or by using the keyword search tool below to find specific information within the annual report.-
 1
1 -
2
-
3
-
4
-
5
-
6
-
7
-
8
-
9
-
10
-
11
-
12
-
13
-
14
-
15
-
16
-
17
-
18
-
19
-
20
-
21
-
22
-
 23
23 -
 24
24 -
 25
25 -
 26
26 -
 27
27 -
 28
28 -
 29
29 -
 30
30 -
 31
31 -
 32
32 -
 33
33 -
 34
34 -
 35
35 -
 36
36 -
 37
37 -
 38
38 -
 39
39 -
 40
40 -
 41
41 -
 42
42 -
 43
43 -
44
-
45
-
46
-
47
-
48
-
49
-
50
-
51
-
52
-
53
-
54
-
55
-
56
-
57
-
58
-
59
-
60
-
61
-
62
-
63
-
64
-
65
-
66
-
67
-
68
-
69
-
70
-
71
-
72
-
73
-
74
 |
 |

31
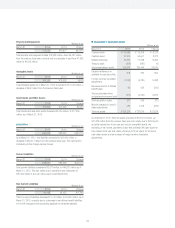
Property and Equipment Millions of yen
March 31 2015 2014 Change
¥13,620 ¥19,917 ¥(6,297)
Total property and equipment totaled ¥13,620 million, down ¥6,297 million
from the previous fiscal year, primarily due to a decrease in land from ¥7,939
million to ¥4,008 million.
Intangible Assets Millions of yen
March 31 2015 2014 Change
¥10,192 ¥10,835 ¥(642)
Total intangible assets as of March 31, 2015 amounted to ¥10,192 million, a
decrease of ¥642 million from the previous fiscal year.
Investments and Other Assets Millions of yen
March 31 2015 2014 Change
¥17,309 ¥12,259 ¥5,050
Total investments and other assets increased ¥5,050 million, to ¥17,309
million, as of March 31, 2015.
■ Liabilities Millions of yen
March 31 2015 2014 Change
¥56,623 ¥88,940 ¥(32,317)
As of March 31, 2015, total liabilities amounted to ¥56,623 million, a
decrease of ¥32,317 million from the previous fiscal year. The main factors
contributing to the change were as follows:
Current Liabilities Millions of yen
March 31 2015 2014 Change
¥49,931 ¥80,508 ¥(30,577)
Total current liabilities decreased ¥30,577 million, to ¥49,931 million as of
March 31, 2015. This was mainly due to conversion and redemption of
¥35,000 million in euro yen zero-coupon convertible bonds.
Non-Current Liabilities Millions of yen
March 31 2015 2014 Change
¥6,692 ¥8,432 ¥(1,740)
Total non-current liabilities decreased ¥1,740 million, to ¥6,692 million, as of
March 31, 2015, primarily due to a decrease in net defined benefit liabilities
in line with changes in the accounting standard for retirement benefits.
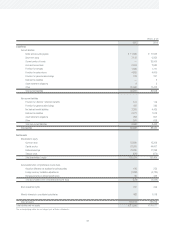
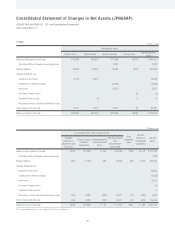
■ Shareholders’ Equity/Net Assets
Millions of yen
March 31 2015 2014 Change
Common stock ¥ 23,680 ¥ 15,368 ¥ 8,312
Capital surplus 52,920 44,607 8,312
Retained earnings 79,355 71,298 8,056
Treasury stock (876) (870) (6)
Total shareholders’ equity 155,079 130,404 24,675
Valuation difference on
available-for-sale securities 618 253 364
Foreign currency translation
adjustments (1,292) (4,780) 3,488
Remeasurements of defi ned
benefi t plans 99 432 (332)
Total accumulated other
comprehensive income (loss) (574) (4,094) 3,520
Stock acquisition rights 327 348 (21)
Minority interests in consoli-
dated subsidiaries 482 1,018 (536)
Total net assets ¥155,314 ¥127,676 ¥27,638
As of March 31, 2015, total net assets amounted to ¥155,314 million, up
¥27,638 million from the previous fiscal year-end, mainly due to factors such
as partial redemption of euro yen zero-coupon convertible bonds, the
recording of net income, payments of year-end dividends (¥20 per share) for
the previous fiscal year and interim dividends (¥10 per share) for the fiscal
year under review, and an increase in foreign currency translation
adjustments.