Square Enix 2015 Annual Report Download - page 3
Download and view the complete annual report
Please find page 3 of the 2015 Square Enix annual report below. You can navigate through the pages in the report by either clicking on the pages listed below, or by using the keyword search tool below to find specific information within the annual report.-
 1
1 -
 2
2 -
 3
3 -
 4
4 -
 5
5 -
 6
6 -
 7
7 -
 8
8 -
 9
9 -
 10
10 -
 11
11 -
 12
12 -
 13
13 -
 14
14 -
15
-
16
-
17
-
18
-
19
-
20
-
21
-
22
-
23
-
24
-
25
-
26
-
27
-
28
-
29
-
30
-
31
-
32
-
33
-
34
-
35
-
36
-
37
-
38
-
39
-
40
-
41
-
42
-
43
-
44
-
45
-
46
-
47
-
48
-
49
-
50
-
51
-
52
-
53
-
54
-
55
-
56
-
57
-
58
-
59
-
60
-
61
-
62
-
63
-
64
-
65
-
66
-
67
-
68
-
69
-
70
-
71
-
72
-
73
-
74
 |
 |

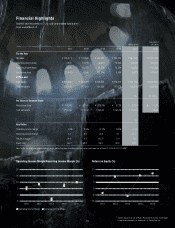
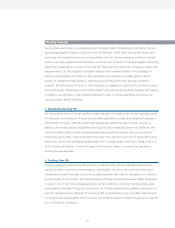
Financial Highlights
SQUARE ENIX HOLDINGS CO., LTD. and Consolidated Subsidiaries
Years ended March 31
Millions of Yen
Thousands of
U.S. Dollars
2011 2012 2013 2014 2015 2015
For the Year
Net sales ¥ 125,271 ¥ 127,896 ¥ 147,981 ¥ 155,023 ¥ 167,891 $1,397,114
Operating income (loss) 7,325 10,713 (6,081) 10,543 16,426 136,697
Recurring income (loss) 5,390 10,297 (4,378) 12,534 16,984 141,339
Net income (loss) (12,043) 6,060 (13,714) 6,598 9,831 81,810
At Year-end
Total assets ¥ 206,336 ¥ 213,981 ¥ 202,509 ¥ 216,617 ¥ 211,938 $1,763,654
Total net assets 135,143 137,297 121,636 127,676 155,314 1,292,459
Yen U.S. Dollars
Per Share of Common Stock
Net income (loss) ¥ (104.66) ¥ 52.66 ¥ (119.19) ¥ 57.28 ¥ 84.34 $ 0.70
Total net assets 1,160.66 1,177.87 1,043.62 1,095.78 1,267.24 10.55
%
Key Ratios
Operating income margin 5.8% 8.4% (4.1)% 6.8% 9.8%
Recurring income margin 4.3 8.0 (2.9) 8.1 10.1
Return on equity (8.4) 4.5 (10.7) 5.4 7.0
Equity ratio 64.7 63.3 59.3 58.3 72.9
Note: For the convenience of readers, amounts in U.S. dollars have been translated using the currency exchange rate at March 31, 2015 of ¥120.17=US$1.
Operating Income Margin/Recurring Income Margin (%) Return on Equity (%)
Operating Income Margin Recurring Income Margin
20
15
10
5
0
-5
2013 20142011 2012
10
5
0
-5
-10
-15
2013 20142015 20152011 2012
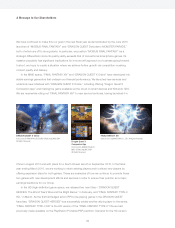
©2015 Square Enix Ltd. All Rights Reserved. Rise of the Tomb Raider
is registered trademarks or trademarks of Square Enix Ltd.
01