Square Enix 2015 Annual Report Download - page 34
Download and view the complete annual report
Please find page 34 of the 2015 Square Enix annual report below. You can navigate through the pages in the report by either clicking on the pages listed below, or by using the keyword search tool below to find specific information within the annual report.
32
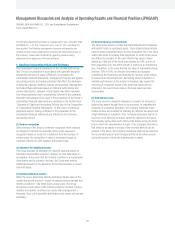
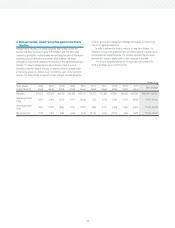
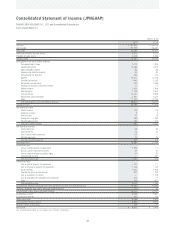
■ Consolidated Statement of Income
Net Sales and Operating Income Millions of yen
Years ended March 31 2015 Composition 2014 Composition Amount
change
Percent
change
Net sales ¥167,891 100.0% ¥155,023 100.0% ¥12,867 8.3%
Gross profi t 73,096 43.5% 60,542 39.1% 12,554 20.7%
Reversal of provision for sales returns 4,877 2.9% 4,672 3.0% 204 4.4%
Provision for sales returns 4,579 2.7% 4,458 2.9% 121 2.7%
Net gross profi t 73,394 43.7% 60,756 39.2% 12,638 20.8%
Selling, general and administrative expenses 56,967 33.9% 50,213 32.4% 6,754 13.5%
Operating income ¥ 16,426 9.8% ¥ 10,543 6.8% ¥ 5,883 55.8%
Comparisons by segment with the previous fiscal year are provided on pages 12–15.
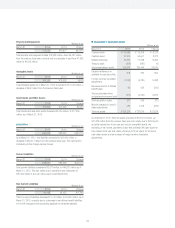
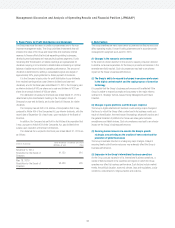
■ Capital Expenditures and Depreciation and Amortization
Millions of yen
Years ended March 31 2015 2014 Change
Capital expenditures ¥6,048 ¥5,376 ¥671
Depreciation and amortization
6,934 6,614 320
Capital expenditures for the fiscal year ended March 31, 2015 amounted to
¥6,048 million, an increase of ¥671 million from the previous fiscal year,
mainly due to the relocation of subsidiaries’ offices and other factors.
Depreciation and amortization totaled ¥6,934 million, an increase of
¥320 million from the previous fiscal year, primarily due to an increase in
depreciation and amortization in the digital entertainment business.
Non-Operating Income and Expenses
Millions of yen
Years ended March 31 2015 2014 Change
Non-operating income ¥890 ¥2,150 ¥(1,260)
Non-operating expenses 332 159 172
Extraordinary Gain and Loss Millions of yen
Years ended March 31 2015 2014 Change
Extraordinary gain ¥1,520 ¥ 413 ¥1,107
Extraordinary loss 3,062 2,783 278
Total extraordinary gain was ¥1,520 million, mainly due to gain on sale of
property and equipment of ¥1,394 million in line with sale of land and other
properties.
Total extraordinary loss was ¥3,062 million, mainly due to loss on sale
of property and equipment of ¥741 million and an impairment loss of ¥640
million related to amusement machines and others.
Management Discussion and Analysis of Operating Results and Financial Position (JPNGAAP)


