Square Enix 2015 Annual Report Download - page 32
Download and view the complete annual report
Please find page 32 of the 2015 Square Enix annual report below. You can navigate through the pages in the report by either clicking on the pages listed below, or by using the keyword search tool below to find specific information within the annual report.-
 1
1 -
2
-
3
-
4
-
5
-
6
-
7
-
8
-
9
-
10
-
11
-
12
-
13
-
14
-
15
-
16
-
17
-
18
-
19
-
20
-
21
-
 22
22 -
 23
23 -
 24
24 -
 25
25 -
 26
26 -
 27
27 -
 28
28 -
 29
29 -
 30
30 -
 31
31 -
 32
32 -
 33
33 -
 34
34 -
 35
35 -
 36
36 -
 37
37 -
 38
38 -
 39
39 -
 40
40 -
 41
41 -
 42
42 -
43
-
44
-
45
-
46
-
47
-
48
-
49
-
50
-
51
-
52
-
53
-
54
-
55
-
56
-
57
-
58
-
59
-
60
-
61
-
62
-
63
-
64
-
65
-
66
-
67
-
68
-
69
-
70
-
71
-
72
-
73
-
74
 |
 |
30
2. Analysis of Financial Policy, Capital Resources and
Liquidity
The Group meets its working capital and capital investment requirements
principally through internal funding resources and the issuance of corporate
bonds. As of March 31, 2015, the Group’s balance of interest-bearing debt
was ¥7,168 million. The equity ratio stood at 72.9%. Cash and cash
equivalents at the end of the year totaled ¥103,147 million, a decrease of
¥10,359 million from the previous fiscal year-end.
Cash flows in the fiscal year ended March 31, 2015, as well as the
principal factors behind these cash flows, are described below.
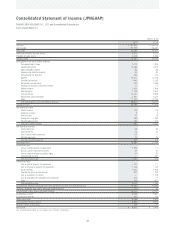
(1) Net cash provided by operating activities
Net cash provided by operating activities totaled ¥8,132 million, a decrease
of 62.5% from the previous fiscal year. This position was primarily due to
income before income taxes and minority interests of ¥15,310 million,
increase in inventories of ¥12,799 million, decrease in notes and accounts
receivable of ¥1,973 million, depreciation and amortization of ¥6,934 million,
and income taxes paid of ¥4,530 million.
(2) Net cash used in investing activities
Net cash used in investing activities totaled ¥1,876 million, a decrease of
68.5% from the previous fiscal year. The main factors were purchases of
property and equipment of ¥4,767 million, purchases of investments in
subsidiaries of ¥1,872 million, payments for guarantee deposits of
¥1,007 million, and proceeds from sales of property and equipment of
¥5,884 million.
(3) Net cash used in financing activities
Net cash used in financing activities totaled ¥22,105 million, an increase of
543.0% from the previous fiscal year. The main factors were redemption of
bonds of ¥18,462 million and cash dividends paid of ¥3,450 million.
The Group believes that it will be possible to procure the funds required
for working capital and capital investments in the future to maintain growth
based on its sound financial standing and ability to generate cash through
operating activities.
3. Analysis of Business Performance in the Fiscal Year Ended
March 31, 2015
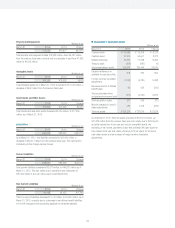
■ Assets
Total Assets Millions of yen
March 31 2015 2014 Change
¥211,938 ¥216,617 ¥(4,678)
Total assets as of March 31, 2015 amounted to ¥211,938 million, a
decrease of ¥4,678 million from the previous fiscal year. The main factors
contributing to the change were as follows:
Cash and Deposits Millions of yen
March 31 2015 2014 Change
¥103,631 ¥115,367 ¥(11,735)
Cash and deposits as of March 31, 2015 decreased ¥11,735 million, to
¥103,631 million, mainly reflecting redemption of bonds of ¥18,462 million
and cash dividends paid of ¥3,450 million as well as income before income
taxes and minority interests of ¥15,310 million, among other factors.
Content Production Account Millions of yen
March 31 2015 2014 Change
¥35,113 ¥20,556 ¥14,556
As a rule, content development costs incurred during the period from a title’s
formal development authorization through to its release are capitalized in the
content production account. When the title is released, this amount is then
recorded as an expense. The content production account is appropriately
revalued in accordance with changes in the business environment.
As of March 31, 2015, the content production account totaled ¥35,113
million, an increase of ¥14,556 million from the previous fiscal year.
Management Discussion and Analysis of Operating Results and Financial Position (JPNGAAP)