Square Enix 2015 Annual Report Download - page 35
Download and view the complete annual report
Please find page 35 of the 2015 Square Enix annual report below. You can navigate through the pages in the report by either clicking on the pages listed below, or by using the keyword search tool below to find specific information within the annual report.-
 1
1 -
2
-
3
-
4
-
5
-
6
-
7
-
8
-
9
-
10
-
11
-
12
-
13
-
14
-
15
-
16
-
17
-
18
-
19
-
20
-
21
-
22
-
23
-
24
-
 25
25 -
 26
26 -
 27
27 -
 28
28 -
 29
29 -
 30
30 -
 31
31 -
 32
32 -
 33
33 -
 34
34 -
 35
35 -
 36
36 -
 37
37 -
 38
38 -
 39
39 -
 40
40 -
 41
41 -
 42
42 -
 43
43 -
 44
44 -
 45
45 -
46
-
47
-
48
-
49
-
50
-
51
-
52
-
53
-
54
-
55
-
56
-
57
-
58
-
59
-
60
-
61
-
62
-
63
-
64
-
65
-
66
-
67
-
68
-
69
-
70
-
71
-
72
-
73
-
74
 |
 |

33
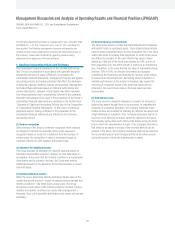
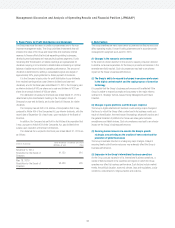
4. Strategic Outlook, Issues Facing Management and Future
Direction
Management’s key task is to create advanced, high-quality content and
services that allow the Group to grow in the medium and long term while
maintaining profitability. As the development and popularization of information
technology (IT) and network environments rapidly advance, the Group
anticipates a major transformation in the structure of the digital entertainment
industry. The Group believes that this will be driven by factors such as
increased consumer needs in the area of network-compliant entertainment
and growing access to a diverse range of content by users of multi-function
devices. The Group strives to respond to these changes, and has adopted a
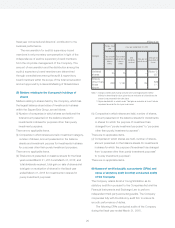
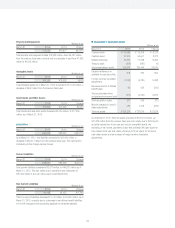
Millions of yen
Years ended/
ending March 31
2006
actual
2007
actual
2008
actual
2009
actual
2010
actual
2011
actual
2012
actual
2013
actual
2014
actual
2015
actual 2016 forecast
Net sales
¥124,473 ¥163,472 ¥147,516 ¥135,693 ¥192,257 ¥125,271 ¥127,896 ¥147,981 ¥155,023
¥167,891 ¥200,000–220,000
Operating income
(loss)
15,470 25,916 21,520 12,277 28,235 7,325 10,713 (6,081) 10,543
16,426 17,000–25,000
Recurring income
(loss)
15,547 26,241 18,864 11,261 27,822 5,390 10,297 (4,378) 12,534
16,984 17,000–25,000
Net income (loss)
17,076 11,619 9,196 6,333 9,509 (12,043) 6,060 (13,714) 6,598
9,831 11,000–18,000
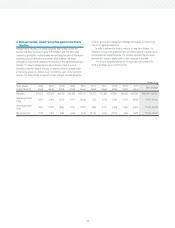
medium- to long-term management strategy that focuses on pioneering a
new era in digital entertainment.
In order to achieve the Group’s medium- to long-term strategy, it is
imperative to expand its global business and meet customers’ diverse needs
for entertainment content/services. It is critically important that the Group
acquires and develops ideally suited human resources to that end.
The Group’s operating forecast for the fiscal year ending March 31,
2016 is as follows (as of June 30, 2015).