Square Enix 2015 Annual Report Download - page 14
Download and view the complete annual report
Please find page 14 of the 2015 Square Enix annual report below. You can navigate through the pages in the report by either clicking on the pages listed below, or by using the keyword search tool below to find specific information within the annual report.-
 1
1 -
2
-
3
-
 4
4 -
 5
5 -
 6
6 -
 7
7 -
 8
8 -
 9
9 -
 10
10 -
 11
11 -
 12
12 -
 13
13 -
 14
14 -
 15
15 -
 16
16 -
 17
17 -
 18
18 -
 19
19 -
 20
20 -
 21
21 -
 22
22 -
 23
23 -
 24
24 -
25
-
26
-
27
-
28
-
29
-
30
-
31
-
32
-
33
-
34
-
35
-
36
-
37
-
38
-
39
-
40
-
41
-
42
-
43
-
44
-
45
-
46
-
47
-
48
-
49
-
50
-
51
-
52
-
53
-
54
-
55
-
56
-
57
-
58
-
59
-
60
-
61
-
62
-
63
-
64
-
65
-
66
-
67
-
68
-
69
-
70
-
71
-
72
-
73
-
74
 |
 |
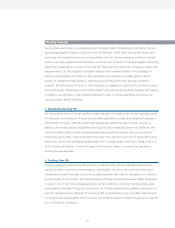
The Square Enix Group (the “Group”) is continuing determined efforts to strengthen the competitiveness and
profitability of its business segments of Digital Entertainment, Amusement, Publication and Merchandising.
Net sales for the fiscal year ended March 31, 2015 totaled ¥167,891 million (an increase of 8.3% from the
prior fiscal year); operating income amounted to ¥16,426 million (an increase of 55.8% from the prior fiscal year);
and recurring income amounted to ¥16,984 million (an increase of 35.5% from the prior fiscal year).
The Group booked gain on sales of property and equipment as extraordinary profit of ¥1,394 million, and loss on
sales of property and equipment as an extraordinary loss of ¥741 million, both of which were due to multiple real estate
sales, in addition to the impairment loss of ¥640 million, primarily with regard to amusement machines.
These factors resulted in net income amounting to ¥9,831 million (an increase of 49.0% from the prior fiscal year).
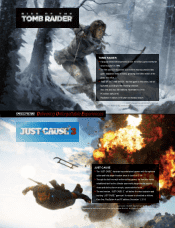
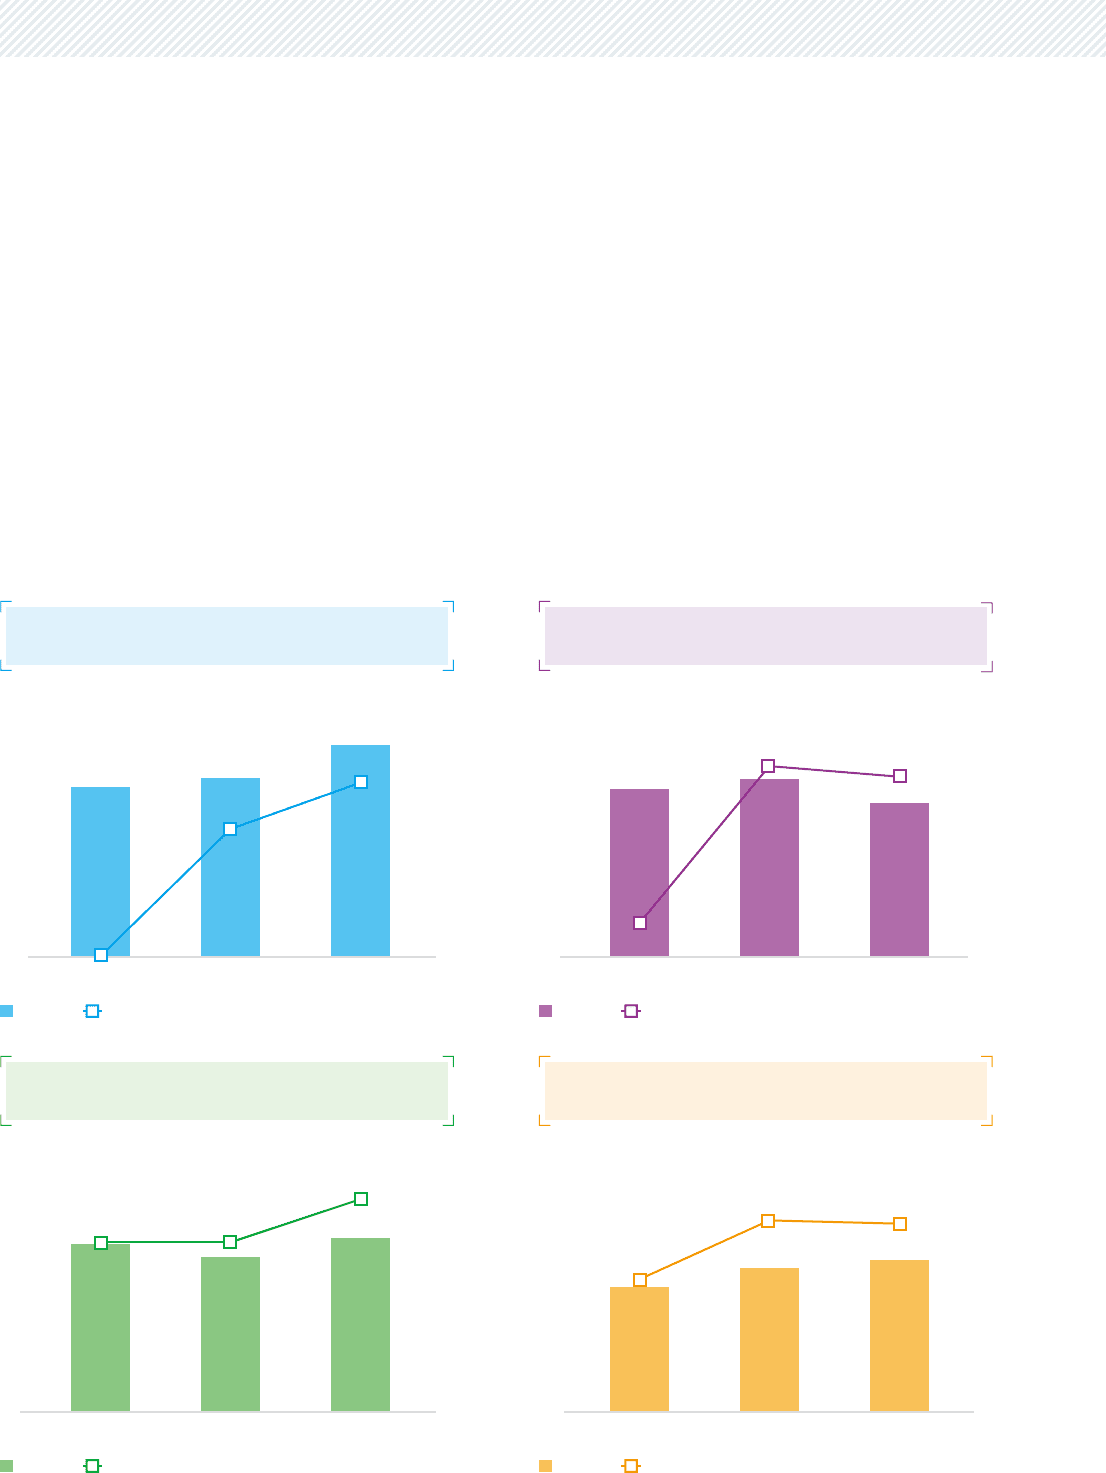
Digital Entertainment
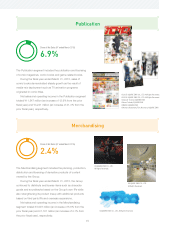
Publication
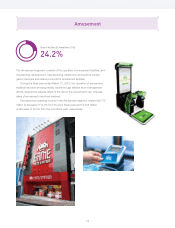
Amusement
Merchandising
2013 2014 2015
120
96
72
48
24
0
20
16
12
8
4
0
11.3%
15.4%
0.0%
89.5 94.6
111.9
2013 2014 2015
15
12
9
6
3
0
30
24
18
12
6
0
28.1%
22.4% 22.4%
11.1 10.2
11.5
2013 2014 2015
60
48
36
24
12
0
12
9
6
3
0
−3
9.6% 8.9%
‒0.8%
44.3 47.0
40.7
2013 2014 2015
6.0
4.8
3.6
2.4
1.2
0
35
28
21
14
7
0
20.4%
29.5% 29.0%
3.3
3.8 4.0
Review of Operations
(Billions of yen)
(Billions of yen)
(Billions of yen)
(Billions of yen)
Net Sales
Net Sales
Operating Income Margin
Operating Income Margin
Net Sales Operating Income Margin
Net Sales Operating Income Margin
12