Shutterfly 2015 Annual Report Download - page 66
Download and view the complete annual report
Please find page 66 of the 2015 Shutterfly annual report below. You can navigate through the pages in the report by either clicking on the pages listed below, or by using the keyword search tool below to find specific information within the annual report.-
 1
1 -
2
-
3
-
4
-
5
-
6
-
7
-
8
-
9
-
10
-
11
-
12
-
13
-
14
-
15
-
16
-
17
-
18
-
19
-
20
-
21
-
22
-
23
-
24
-
25
-
26
-
27
-
28
-
29
-
30
-
31
-
32
-
33
-
34
-
35
-
36
-
37
-
38
-
39
-
40
-
41
-
42
-
43
-
44
-
45
-
46
-
47
-
48
-
49
-
50
-
51
-
52
-
53
-
54
-
55
-
 56
56 -
 57
57 -
 58
58 -
 59
59 -
 60
60 -
 61
61 -
 62
62 -
 63
63 -
 64
64 -
 65
65 -
 66
66 -
 67
67 -
 68
68 -
 69
69 -
 70
70 -
 71
71 -
 72
72 -
 73
73 -
 74
74 -
 75
75 -
 76
76 -
77
-
78
-
79
-
80
-
81
-
82
-
83
-
84
-
85
-
86
-
87
-
88
-
89
-
90
-
91
-
92
-
93
-
94
-
95
-
96
-
97
-
98
-
99
-
100
-
101
-
102
-
103
-
104
-
105
-
106
-
107
-
108
-
109
-
110
-
111
-
112
-
113
-
114
-
115
-
116
-
117
-
118
-
119
-
120
-
121
-
122
-
123
-
124
-
125
-
126
-
127
-
128
-
129
-
130
-
131
-
132
 |
 |
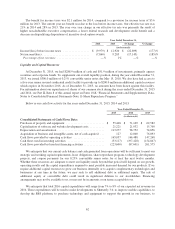
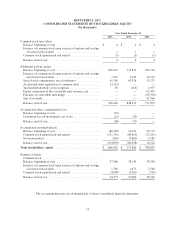
For 2014, net cash used in investing activities was $197.4 million. We used $124.1 million to purchase
investments. We used $71.2 million for capital expenditures for computer and network hardware to support our
website infrastructure and information technology systems and for production equipment for our manufacturing
and production operations, $21.0 million for capitalized software and website development, and $12.0 million to
acquire certain assets of Groovebook. This was partially offset from proceeds from the sales and maturities of
investments, and equipment and rental assets of $30.0 million and $0.9 million, respectively.
For 2013, net cash used in investing activities was $154.8 million. We used $76.9 million to acquire
MyPublisher, R&R Images, and BorrowLenses, net of cash acquired, and to settle other acquisition related
liabilities. We used $62.6 million for capital expenditures for computer and network hardware and production
equipment for our manufacturing operations, and $15.8 million of capitalized software and website development.
Additionally, we received proceeds of $0.4 million from the sale of equipment.
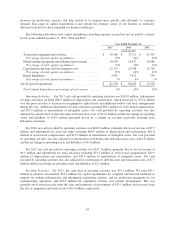
Financing Activities. For 2015, net cash used in financing activities was $223.6 million. We used $215.9
million to repurchase shares of our common stock and $12.7 million for payments of capital leases and financing
obligations. We also received $3.2 million of proceeds from issuance of common stock from the exercise of
options and recorded $1.8 million from excess tax benefit from stock-based compensation.
For 2014, net cash used in financing activities was $87.6 million. We used $88.8 million to repurchase
shares of our common stock and $3.1 million for payments of capital leases and financing obligations. We also
received $3.2 million of proceeds from issuance of common stock from the exercise of options and recorded $1.0
million from excess tax benefit from stock-based compensation.
For 2013, net cash provided by financing activities was $261.6 million, primarily from the $291.9 million in
proceeds from the issuance of our 0.25% convertible senior notes in May 2013, $43.6 million in proceeds from
the issuance of warrants, offset by $63.5 million from the purchase of a convertible note hedge and repurchases
of common stock of $32.2 million. We also received $19.1 million of proceeds from issuance of common stock
from the exercise of options and recorded $3.6 million from excess tax benefit from stock-based compensation.
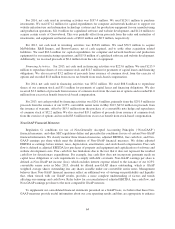
Non-GAAP Financial Measures
Regulation G, conditions for use of Non-Generally Accepted Accounting Principles (“Non-GAAP”)
financial measures, and other SEC regulations define and prescribe the conditions for use of certain Non-GAAP
financial information. We closely monitor three financial measures, adjusted EBITDA, free cash flow, and Non-
GAAP earnings per share which meet the definition of Non-GAAP financial measures. We define adjusted
EBITDA as earnings before interest, taxes, depreciation, amortization, and stock-based compensation. Free cash
flow is defined as adjusted EBITDA less purchases of property and equipment and capitalization of software and
website development costs. Free cash flow has limitations due to the fact that it does not represent the residual
cash flow for discretionary expenditures. For example, free cash flow does not incorporate payments made on
capital lease obligations or cash requirements to comply with debt covenants. Non-GAAP earnings per share is
defined as Non-GAAP net income (loss), which excludes interest expense related to the issuance of our 0.25%
convertible senior notes in May 2013, divided by diluted non-GAAP shares outstanding, which is GAAP
weighted average shares outstanding less any shares issuable under our convertible senior notes. Management
believes these Non-GAAP financial measures reflect an additional way of viewing our profitability and liquidity
that, when viewed with our GAAP results, provides a more complete understanding of factors and trends
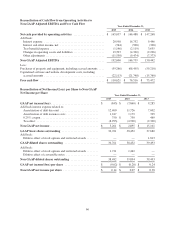
affecting our earnings and cash flows. Refer below for a reconciliation of adjusted EBITDA, free cash flow, and
Non-GAAP earnings per share to the most comparable GAAP measure.
To supplement our consolidated financial statements presented on a GAAP basis, we believe that these Non-
GAAP measures provide useful information about our core operating results and thus are appropriate to enhance
64