Shutterfly 2015 Annual Report Download - page 52
Download and view the complete annual report
Please find page 52 of the 2015 Shutterfly annual report below. You can navigate through the pages in the report by either clicking on the pages listed below, or by using the keyword search tool below to find specific information within the annual report.-
 1
1 -
2
-
3
-
4
-
5
-
6
-
7
-
8
-
9
-
10
-
11
-
12
-
13
-
14
-
15
-
16
-
17
-
18
-
19
-
20
-
21
-
22
-
23
-
24
-
25
-
26
-
27
-
28
-
29
-
30
-
31
-
32
-
33
-
34
-
35
-
36
-
37
-
38
-
39
-
40
-
41
-
 42
42 -
 43
43 -
 44
44 -
 45
45 -
 46
46 -
 47
47 -
 48
48 -
 49
49 -
 50
50 -
 51
51 -
 52
52 -
 53
53 -
 54
54 -
 55
55 -
 56
56 -
 57
57 -
 58
58 -
 59
59 -
 60
60 -
 61
61 -
 62
62 -
63
-
64
-
65
-
66
-
67
-
68
-
69
-
70
-
71
-
72
-
73
-
74
-
75
-
76
-
77
-
78
-
79
-
80
-
81
-
82
-
83
-
84
-
85
-
86
-
87
-
88
-
89
-
90
-
91
-
92
-
93
-
94
-
95
-
96
-
97
-
98
-
99
-
100
-
101
-
102
-
103
-
104
-
105
-
106
-
107
-
108
-
109
-
110
-
111
-
112
-
113
-
114
-
115
-
116
-
117
-
118
-
119
-
120
-
121
-
122
-
123
-
124
-
125
-
126
-
127
-
128
-
129
-
130
-
131
-
132
 |
 |

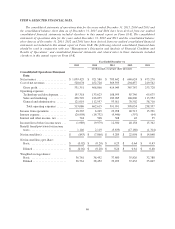
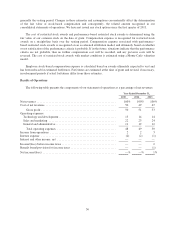
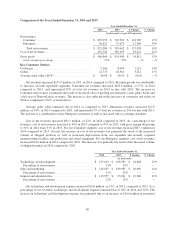
Enterprise. Our Enterprise revenues are primarily from variable, four-color direct marketing collateral
manufactured and fulfilled for business customers. We continue to focus our efforts in expanding our
presence in this market.
Year Ended December 31,
2015 2014 2013
Consumer
Net revenues .............................................. $ 961,418 $ 870,959 $ 745,970
Cost of net revenues ........................................ 436,050 394,265 327,145
Gross profit ............................................... $ 525,368 $ 476,694 $ 418,825
Gross profit as a percentage of net revenues ..................... 55% 55% 56%
Enterprise
Net revenues .............................................. $ 98,011 $ 50,621 $ 37,672
Cost of net revenues ........................................ 79,789 43,456 29,480
Gross profit ............................................... $ 18,222 $ 7,165 $ 8,192
Gross profit as a percentage of net revenues ..................... 19% 14% 22%
Corporate
Net revenues .............................................. $ — $ — $ —
Cost of net revenues ........................................ 12,239 14,999 12,968
Gross profit ............................................... $ (12,239) $ (14,999) $ (12,968)
Consolidated
Net revenues .............................................. $ 1,059,429 $ 921,580 $ 783,642
Cost of net revenues ........................................ 528,078 452,720 369,593
Gross profit ............................................... $ 531,351 $ 468,860 $ 414,049
Gross profit as a percentage of net revenues ..................... 50% 51% 53%
In addition to the two reportable segments, we also have a corporate category that includes activities that are
not directly attributable or allocable to a specific segment. This category consists of stock-based compensation
and amortization of intangible assets.
Our Consumer segment is subject to seasonal fluctuations. In particular, we generate a substantial portion of
our revenues during the holiday season in the fourth quarter. We also typically experience increases in net
revenues during other shopping-related seasonal events, such as Easter, Mother’s Day, Father’s Day, and
Halloween. We generally experience lower net revenues during the first, second and third calendar quarters and
have incurred and may continue to incur losses in these quarters. Due to the relatively short lead time required to
fulfill product orders, usually one to three business days, order backlog is not material to our business.
To further understand net revenue trends in our Consumer segment, we monitor several key metrics
including, total customers, total number of orders, and average order value.
Total Customers. We closely monitor total customers as a key indicator of demand. Total customers
represents the number of transacting customers in a given period. We seek to expand our customer base by
empowering our existing customers with sharing and collaboration services, and by conducting integrated
marketing and advertising programs. We also acquire new customers through customer list acquisitions.
Total customers have increased on an annual basis for each year since inception and we expect this trend to
continue.
50