Shutterfly 2015 Annual Report Download - page 63
Download and view the complete annual report
Please find page 63 of the 2015 Shutterfly annual report below. You can navigate through the pages in the report by either clicking on the pages listed below, or by using the keyword search tool below to find specific information within the annual report.-
 1
1 -
2
-
3
-
4
-
5
-
6
-
7
-
8
-
9
-
10
-
11
-
12
-
13
-
14
-
15
-
16
-
17
-
18
-
19
-
20
-
21
-
22
-
23
-
24
-
25
-
26
-
27
-
28
-
29
-
30
-
31
-
32
-
33
-
34
-
35
-
36
-
37
-
38
-
39
-
40
-
41
-
42
-
43
-
44
-
45
-
46
-
47
-
48
-
49
-
50
-
51
-
52
-
 53
53 -
 54
54 -
 55
55 -
 56
56 -
 57
57 -
 58
58 -
 59
59 -
 60
60 -
 61
61 -
 62
62 -
 63
63 -
 64
64 -
 65
65 -
 66
66 -
 67
67 -
 68
68 -
 69
69 -
 70
70 -
 71
71 -
 72
72 -
 73
73 -
74
-
75
-
76
-
77
-
78
-
79
-
80
-
81
-
82
-
83
-
84
-
85
-
86
-
87
-
88
-
89
-
90
-
91
-
92
-
93
-
94
-
95
-
96
-
97
-
98
-
99
-
100
-
101
-
102
-
103
-
104
-
105
-
106
-
107
-
108
-
109
-
110
-
111
-
112
-
113
-
114
-
115
-
116
-
117
-
118
-
119
-
120
-
121
-
122
-
123
-
124
-
125
-
126
-
127
-
128
-
129
-
130
-
131
-
132
 |
 |

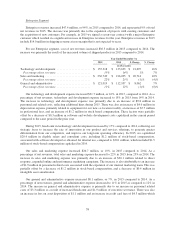
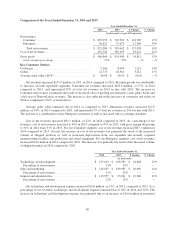
and related costs, reflecting additional hires during 2014. There was also an increase of $9.3 million in
depreciation expense primarily related to equipment for our new co-location facility, an increase of $5.8 million
in professional fees, and an increase of $3.1 million in facility costs primarily from co-location services. These
factors were partially offset by an increase of $4.8 million in software and website development costs capitalized
and a decrease in stock based compensation of $0.4 million in the current period compared to the same period in
the prior year.
During 2014, headcount in technology and development increased by 11% compared to 2013, reflecting our
strategic focus to increase the rate of innovation in our product and services offerings, to generate greater
differentiation from our competitors, and improve our long-term operating efficiency. In 2014, we capitalized
$20.1 million in eligible salary and consultant costs, including $1.5 million of stock-based compensation,
associated with software developed or obtained for internal use, compared to $15.3 million, which included $1.7
million of stock-based compensation capitalized in 2013.
Our sales and marketing expense increased $26.1 million, or 14%, in 2014 compared to 2013. As a
percentage of net revenues, total sales and marketing expense increased to 23% in 2014 from 24% in 2013. The
increase in sales and marketing expense was primarily due to an increase of $16.1 million related to direct
response, expanded online and performance marketing campaigns. The increase is also attributable to an increase
of $5.0 million in personnel and related costs associated with the expansion of our internal marketing team, an
increase of $2.9 million in stock-based compensation, and an increase of $1.5 million in intangible asset
amortization primarily from intangibles acquired in the 2013 acquisitions of MyPublisher and BorrowLenses.
Our general and administrative expense increased $19.9 million, or 21%, in 2014 compared to 2013. As a
percentage of net revenues, general and administrative expense remained flat at 12% in 2014 as compared to
2013. The increase in general and administrative expense is primarily due to an increase in stock-based
compensation of $4.4 million and an increase in personnel related costs of $4.2 million as a result of increased
headcount. There was also an increase in credit card fees of $3.5 million which was driven by the increase in
Consumer net revenues as compared to the prior year, an increase in depreciation and amortization of $3.4
million, an increase in professional fees of $2.5 million, and an increase in facility costs of $1.9 million, offset by
proceeds from intellectual property license agreements of $0.6 million.
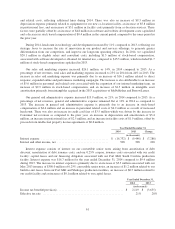
Year Ended December 31,
2014 2013 Change
(in thousands)
Interest expense .............................................. $ (16,732) $ (9,446) $ (7,286)
Interest and other income, net ................................... 508 308 200
Interest expense consists of interest on our convertible senior notes arising from amortization of debt
discount, amortization of debt issuance costs, and our 0.25% coupon, issuance costs associated with our credit
facility; capital leases and our financing obligation associated with our Fort Mill, South Carolina production
facility. Interest expense was $16.7 million for the year ended December 31, 2014 compared to $9.4 million
during 2013. The increase in interest expense is primarily due to an increase of $5.5 million associated with our
May 2013 issuance of $300.0 million of 0.25% convertible senior notes, an increase of $1.2 million related to our
build-to-suit leases from our Fort Mill and Shakopee production facilities, an increase of $0.5 million related to
our credit facility and an increase of $0.1 million related to our capital leases.
Year Ended December 31,
2014 2013
(in thousands)
Income tax benefit/(provision) ............................................. $ 2,119 $ (3,635)
Effective tax rate ....................................................... 21% 28%
61