Shutterfly 2015 Annual Report Download - page 60
Download and view the complete annual report
Please find page 60 of the 2015 Shutterfly annual report below. You can navigate through the pages in the report by either clicking on the pages listed below, or by using the keyword search tool below to find specific information within the annual report.-
 1
1 -
2
-
3
-
4
-
5
-
6
-
7
-
8
-
9
-
10
-
11
-
12
-
13
-
14
-
15
-
16
-
17
-
18
-
19
-
20
-
21
-
22
-
23
-
24
-
25
-
26
-
27
-
28
-
29
-
30
-
31
-
32
-
33
-
34
-
35
-
36
-
37
-
38
-
39
-
40
-
41
-
42
-
43
-
44
-
45
-
46
-
47
-
48
-
49
-
 50
50 -
 51
51 -
 52
52 -
 53
53 -
 54
54 -
 55
55 -
 56
56 -
 57
57 -
 58
58 -
 59
59 -
 60
60 -
 61
61 -
 62
62 -
 63
63 -
 64
64 -
 65
65 -
 66
66 -
 67
67 -
 68
68 -
 69
69 -
 70
70 -
71
-
72
-
73
-
74
-
75
-
76
-
77
-
78
-
79
-
80
-
81
-
82
-
83
-
84
-
85
-
86
-
87
-
88
-
89
-
90
-
91
-
92
-
93
-
94
-
95
-
96
-
97
-
98
-
99
-
100
-
101
-
102
-
103
-
104
-
105
-
106
-
107
-
108
-
109
-
110
-
111
-
112
-
113
-
114
-
115
-
116
-
117
-
118
-
119
-
120
-
121
-
122
-
123
-
124
-
125
-
126
-
127
-
128
-
129
-
130
-
131
-
132
 |
 |

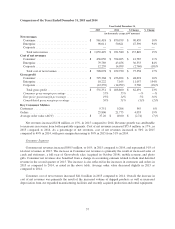
Enterprise Segment
Enterprise revenues increased $47.4 million, or 94%, in 2015 compared to 2014, and represented 9% of total
net revenues in 2015. The increase was primarily due to the expansion of projects with existing customers and
the acquisition of new customers. For example, in 2015 we signed a seven-year contract with a major Enterprise
customer which resulted in a significant increase in Enterprise revenues for the year. Enterprise revenues in 2015
include $14.0 million in shipping revenue at zero margin that is not expected to recur.
For our Enterprise segment, cost of net revenues increased $36.3 million in 2015 compared to 2014. The
increase was primarily the result of the increased volume of shipped products in 2015 compared to 2014.
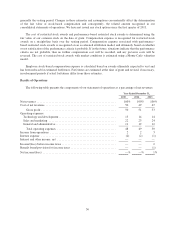
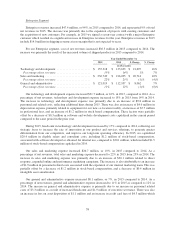
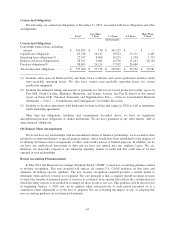
Year Ended December 31,
2015 2014 $ Change % Change
(in thousands)
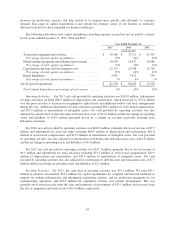
Technology and development ....................... $ 155,318 $ 133,623 $ 21,695 16%
Percentage of net revenues ....................... 15% 14% 1% 7%
Sales and marketing ............................... $ 236,749 $ 216,035 $ 20,714 10%
Percentage of net revenues ....................... 22% 23% (1)% (4)%
General and administrative ......................... $ 121,019 $ 112,957 $ 8,062 7%
Percentage of net revenues ....................... 11% 12% (1)% (8)%
Our technology and development expense increased $21.7 million, or 16%, in 2015, compared to 2014. As a
percentage of net revenues, technology and development expense increased to 15% in 2015 from 14% in 2014.
The increase in technology and development expense was primarily due to an increase of $9.8 million in
personnel and related costs, reflecting additional hires during 2015. There was also an increase of $4.6 million in
depreciation expense primarily related to equipment for our new co-location facility, an increase of $5.7 million
in professional fees, and an increase of $1.2 million in stock based compensation. These factors were partially
offset by a decrease of $0.3 million in software and website development costs capitalized in the current period
compared to the same period in the prior year.
During 2015, headcount in technology and development increased by 17% compared to 2014, reflecting our
strategic focus to increase the rate of innovation in our product and services offerings, to generate greater
differentiation from our competitors, and improve our long-term operating efficiency. In 2015, we capitalized
$20.4 million in eligible salary and consultant costs, including $1.2 million of stock-based compensation,
associated with software developed or obtained for internal use, compared to $20.1 million, which included $1.5
million of stock-based compensation capitalized in 2014.
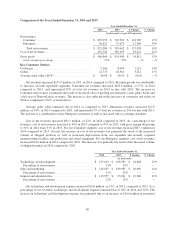
Our sales and marketing expense increased $20.7 million, or 10%, in 2015 compared to 2014. As a
percentage of net revenues, total sales and marketing expense decreased to 22% in 2015 from 23% in 2014. The
increase in sales and marketing expense was primarily due to an increase of $20.1 million related to direct
response, expanded online and performance marketing campaigns. The increase is also attributable to an increase
of $1.9 million in personnel related costs associated with the expansion of our internal marketing team. This was
partially offset by a decrease of $1.2 million in stock-based compensation, and a decrease of $0.4 million in
intangible asset amortization.
Our general and administrative expense increased $8.1 million, or 7%, in 2015 compared to 2014. As a
percentage of net revenues, general and administrative expense decreased to 11% in 2015 as compared to 12% in
2014. The increase in general and administrative expense is primarily due to an increase in personnel related
costs of $3.3 million as a result of increased headcount and $1.9 million of executive severance. There was also
an increase in loss on asset disposition of $1.1 million and an increase in credit card fees of $4.3 million which
58