Shutterfly 2015 Annual Report Download - page 48
Download and view the complete annual report
Please find page 48 of the 2015 Shutterfly annual report below. You can navigate through the pages in the report by either clicking on the pages listed below, or by using the keyword search tool below to find specific information within the annual report.-
 1
1 -
2
-
3
-
4
-
5
-
6
-
7
-
8
-
9
-
10
-
11
-
12
-
13
-
14
-
15
-
16
-
17
-
18
-
19
-
20
-
21
-
22
-
23
-
24
-
25
-
26
-
27
-
28
-
29
-
30
-
31
-
32
-
33
-
34
-
35
-
36
-
37
-
 38
38 -
 39
39 -
 40
40 -
 41
41 -
 42
42 -
 43
43 -
 44
44 -
 45
45 -
 46
46 -
 47
47 -
 48
48 -
 49
49 -
 50
50 -
 51
51 -
 52
52 -
 53
53 -
 54
54 -
 55
55 -
 56
56 -
 57
57 -
 58
58 -
59
-
60
-
61
-
62
-
63
-
64
-
65
-
66
-
67
-
68
-
69
-
70
-
71
-
72
-
73
-
74
-
75
-
76
-
77
-
78
-
79
-
80
-
81
-
82
-
83
-
84
-
85
-
86
-
87
-
88
-
89
-
90
-
91
-
92
-
93
-
94
-
95
-
96
-
97
-
98
-
99
-
100
-
101
-
102
-
103
-
104
-
105
-
106
-
107
-
108
-
109
-
110
-
111
-
112
-
113
-
114
-
115
-
116
-
117
-
118
-
119
-
120
-
121
-
122
-
123
-
124
-
125
-
126
-
127
-
128
-
129
-
130
-
131
-
132
 |
 |

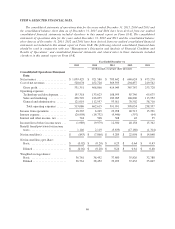
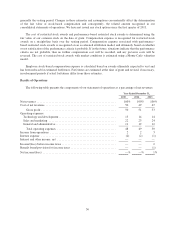
ITEM 6. SELECTED FINANCIAL DATA.
The consolidated statements of operations data for the years ended December 31, 2015, 2014 and 2013 and
the consolidated balance sheet data as of December 31, 2015 and 2014 have been derived from our audited
consolidated financial statements included elsewhere in this annual report on Form 10-K. The consolidated
statements of operations data for the years ended December 31, 2012 and 2011 and the consolidated balance
sheet data as of December 31, 2013, 2012 and 2011 have been derived from our audited consolidated financial
statements not included in this annual report on Form 10-K. The following selected consolidated financial data
should be read in conjunction with our “Management’s Discussion and Analysis of Financial Condition and
Results of Operations” and consolidated financial statements and related notes to those statements included
elsewhere in this annual report on Form 10-K.
Year Ended December 31,
2015 2014 2013 2012 2011
(In thousands, except per share amounts)
Consolidated Operations Statement
Data:
Net revenues .................... $ 1,059,429 $ 921,580 $ 783,642 $ 640,624 $ 473,270
Cost of net revenues .............. 528,078 452,720 369,593 294,857 219,542
Gross profit ................... 531,351 468,860 414,049 345,767 253,728
Operating expenses:
Technology and development ..... 155,318 133,623 108,995 85,746 65,675
Sales and marketing ............ 236,749 216,035 189,985 148,806 113,952
General and administrative ....... 121,019 112,957 93,011 70,502 58,710
Total operating expenses ....... 513,086 462,615 391,991 305,054 238,337
Income from operations ........... 18,265 6,245 22,058 40,713 15,391
Interest expense .................. (20,998) (16,732) (9,446) (597) (64)
Interest and other income, net ....... 744 508 308 42 35
Income/(loss) before income taxes . . . (1,989) (9,979) 12,920 40,158 15,362
Benefit from/(provision for) income
taxes ......................... 1,146 2,119 (3,635) (17,160) (1,314)
Net income/(loss) ................ $ (843) $ (7,860) $ 9,285 $ 22,998 $ 14,048
Net income/(loss) per share:
Basic ........................ $ (0.02) $ (0.20) $ 0.25 $ 0.64 $ 0.43
Diluted ....................... $ (0.02) $ (0.20) $ 0.24 $ 0.61 $ 0.40
Weighted average shares:
Basic ........................ 36,761 38,452 37,680 35,826 32,788
Diluted ....................... 36,761 38,452 39,493 37,432 35,007
46