Samsung 2002 Annual Report Download - page 62
Download and view the complete annual report
Please find page 62 of the 2002 Samsung annual report below. You can navigate through the pages in the report by either clicking on the pages listed below, or by using the keyword search tool below to find specific information within the annual report.-
 1
1 -
2
-
3
-
4
-
5
-
6
-
7
-
8
-
9
-
10
-
11
-
12
-
13
-
14
-
15
-
16
-
17
-
18
-
19
-
20
-
21
-
22
-
23
-
24
-
25
-
26
-
27
-
28
-
29
-
30
-
31
-
32
-
33
-
34
-
35
-
36
-
37
-
38
-
39
-
40
-
41
-
42
-
43
-
44
-
45
-
46
-
47
-
48
-
49
-
50
-
51
-
 52
52 -
 53
53 -
 54
54 -
 55
55 -
 56
56 -
 57
57 -
 58
58 -
 59
59 -
 60
60 -
 61
61 -
 62
62 -
 63
63 -
 64
64 -
 65
65 -
 66
66 -
 67
67 -
 68
68 -
 69
69 -
 70
70
 |
 |
63
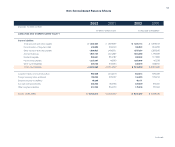
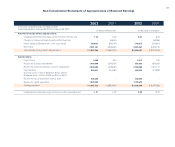
Non-Consolidated Five-Year Financial Summary
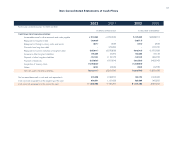
$ 10,123,513 $ 7,926,014 $ 8,660,353 $ 7,729,803 $ 5,380,693
23,636,123 16,493,575 18,570,586 15,080,490 11,259,056
$ 33,759,636 $ 24,419,589 $ 27,230,939 $ 22,810,293 $ 16,639,749
22,454,888 18,487,732 17,468,926 15,424,604 11,578,914
11,304,748 5,931,857 9,762,013 7,385,689 5,060,835
5,267,521 4,200,836 3,856,410 3,471,715 2,492,518
$ 6,037,227 $ 1,731,021 $ 5,905,603 $ 3,913,974 $ 2,568,317
$ 207,151 $ 95,365 $ 124,247 $ 198,900 $ 279,383
243,913 180,429 237,546 233,600 863,231
47,464 35,736 27,102 228,311 -
889,810 591,848 692,079 260,474 -
693,876 469,551 515,843 517,444 371,563
$ 2,082,214 $ 1,372,929 $ 1,596,817 $ 1,438,729 $ 1,514,177
$ 83,751 $ 154,709 $ 272,730 $ 629,868 $ 924,894
--- -1,559,267
185,754 183,196 221,643 244,970 857,732
14,623 68,999 188,911 93,096 -
35,172 40,821 - - -
408,086 331,484 507,131 634,353 375,354
$ 727,386 $ 779,209 $ 1,190,415 $ 1,602,287 $ 3,717,247
$ 7,392,055 $ 2,324,741 $ 6,312,005 $ 3,750,416 $ 365,247
--122,029 - 235,068
---232,540 259,920
$ 7,392,055 $ 2,324,741 $ 6,434,034 $ 3,517,876 $ 340,395
1,515,588 102,316 1,656,806 748,965 $ 80,895
$ 5,876,467 $ 2,222,425 $ 4,777,228 $ 2,768,911 $ 259,500
$ 35 $ 13 $ 28 $ 17 $ 2.14
In thousands of U.S. dollars
2002 2001 2000 1999 1998
Sales:
Domestic
Export
Total sales
Cost of sales
Gross profit
Selling, general and administrative expenses
Operating profit
Non-operating income:
Interest and dividend income
Foreign exchange gain
Gain on foreign currency translation
Earnings from equity method investments
Others
Total non-operating income
Non-operating expenses:
Interest expense
Amortization of deferred charges
Foreign exchange loss
Loss on foreign currency translation
Loss on valuation of inventories
Others
Total non-operating expenses
Ordinary profit
Extraordinary income
Extraordinary loss
Net income before income taxes
Income tax expense
Net income
Earnings per share
For the years ended December 31, 1998-2002