Samsung 2002 Annual Report Download - page 57
Download and view the complete annual report
Please find page 57 of the 2002 Samsung annual report below. You can navigate through the pages in the report by either clicking on the pages listed below, or by using the keyword search tool below to find specific information within the annual report.-
 1
1 -
2
-
3
-
4
-
5
-
6
-
7
-
8
-
9
-
10
-
11
-
12
-
13
-
14
-
15
-
16
-
17
-
18
-
19
-
20
-
21
-
22
-
23
-
24
-
25
-
26
-
27
-
28
-
29
-
30
-
31
-
32
-
33
-
34
-
35
-
36
-
37
-
38
-
39
-
40
-
41
-
42
-
43
-
44
-
45
-
46
-
 47
47 -
 48
48 -
 49
49 -
 50
50 -
 51
51 -
 52
52 -
 53
53 -
 54
54 -
 55
55 -
 56
56 -
 57
57 -
 58
58 -
 59
59 -
 60
60 -
 61
61 -
 62
62 -
 63
63 -
 64
64 -
 65
65 -
 66
66 -
 67
67 -
68
-
69
-
70
 |
 |
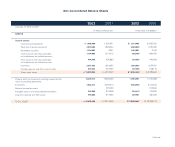
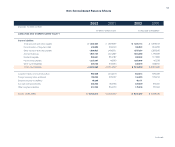
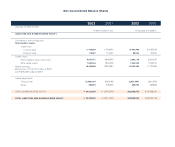
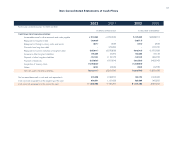
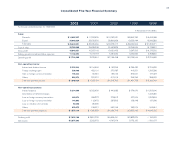
Continued;
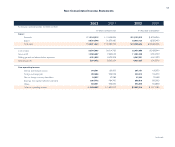
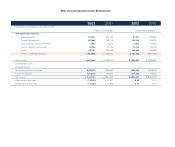
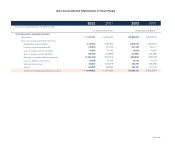
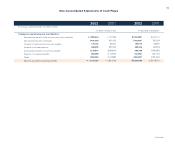
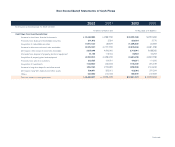
Non-Consolidated Statements of Cash Flows
₩7,051,761 ₩2,946,935 $ 5,876,467 $ 2,455,779
3,155,663 3,186,244 2,629,719 2,655,203
277,515 217,213 231,263 181,011
17,547 91,492 14,623 76,243
(56,957) (47,386) (47,464) (39,488)
(1,067,772) (784,790) (889,810) (653,992)
42,206 54,129 35,172 45,108
424,537 (196,127) 353,781 (163,439)
664,082 608,639 553,401 507,199
₩10,508,582 ₩6,076,349 $ 8,757,152 $ 5,063,624
Cash flows from operating activities:
Net income
Items not involving operating cash flows:
Depreciation and amortization
Provision for severance benefits
Loss on foreign currency translation
Gain on foreign currency translation
Earnings from equity-method investments
Loss on valuation of inventories
Deferred income taxes
Others
Total items not involving operating cash flows
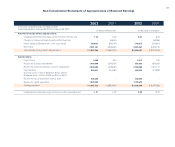
In millions of Korean won In thousands of U.S.dollars
2002 2001 2002 2001
For the years ended December 31, 2002 and 2001