Samsung 2002 Annual Report Download - page 54
Download and view the complete annual report
Please find page 54 of the 2002 Samsung annual report below. You can navigate through the pages in the report by either clicking on the pages listed below, or by using the keyword search tool below to find specific information within the annual report.
55
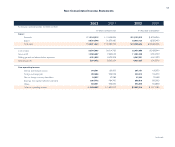
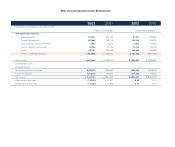
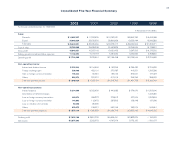
Non-Consolidated Income Statements
Sales:
Domestic
Export
Total sales
Cost of sales
Gross profit
Selling, general and administrative expenses
Operating profit
Non-operating income:
Interest and dividend income
Foreign exchange gain
Gain on foreign currency translation
Earnings from equity-method investments
Others
Total non-operating income
₩12,148,215 ₩10,509,895 $ 10,123,513 $ 8,758,246
28,363,348 21,870,480 23,636,123 18,225,400
₩40,511,563 ₩32,380,375 $ 33,759,636 $ 26,983,646
26,945,866 24,514,733 22,454,888 20,428,944
13,565,697 7,865,642 11,304,748 6,554,702
6,321,025 5,570,308 5,267,521 4,641,923
7,244,672 2,295,334 6,037,227 1,912,779
248,581 126,455 207,151 105,379
292,696 239,248 243,913 199,373
56,957 47,386 47,464 39,488
1,067,772 784,790 889,810 653,992
832,651 622,624 693,876 518,853
₩2,498,657 ₩1,820,503 $ 2,082,214 $ 1,517,085
Continued;
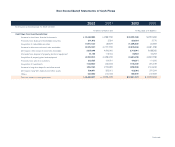
In millions of Korean won In thousands of U.S.dollars
2002 2001 2002 2001
For the years ended December 31, 2002 and 2001


