Samsung 2002 Annual Report Download - page 53
Download and view the complete annual report
Please find page 53 of the 2002 Samsung annual report below. You can navigate through the pages in the report by either clicking on the pages listed below, or by using the keyword search tool below to find specific information within the annual report.-
 1
1 -
2
-
3
-
4
-
5
-
6
-
7
-
8
-
9
-
10
-
11
-
12
-
13
-
14
-
15
-
16
-
17
-
18
-
19
-
20
-
21
-
22
-
23
-
24
-
25
-
26
-
27
-
28
-
29
-
30
-
31
-
32
-
33
-
34
-
35
-
36
-
37
-
38
-
39
-
40
-
41
-
42
-
 43
43 -
 44
44 -
 45
45 -
 46
46 -
 47
47 -
 48
48 -
 49
49 -
 50
50 -
 51
51 -
 52
52 -
 53
53 -
 54
54 -
 55
55 -
 56
56 -
 57
57 -
 58
58 -
 59
59 -
 60
60 -
 61
61 -
 62
62 -
 63
63 -
64
-
65
-
66
-
67
-
68
-
69
-
70
 |
 |
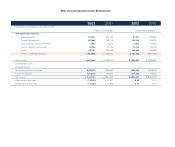
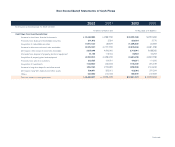
₩769,680 ₩762,650 $ 641,400 $ 635,542
119,467 119,467 99,556 99,556
4,071,741 3,848,792 3,393,118 3,207,327
1,853,166 1,843,458 1,544,305 1,536,215
19,492,068 13,352,987 16,243,390 11,127,489
(2,462,091) (962,248) (2,051,743) (801,873)
466,259 508,643 388,549 423,868
₩24,310,290 ₩19,473,749 $ 20,258,575 $ 16,228,124
₩34,439,600 ₩27,919,406 $ 28,699,667 $ 23,266,172
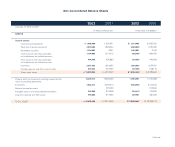
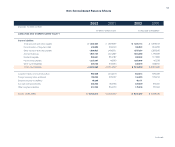
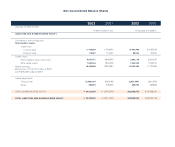
Non-Consolidated Balance Sheets
In millions of Korean won In thousands of U.S.dollars
2002 2001 2002 2001
LIABILITIES AND SHAREHOLDERS’ EQUITY
Commitments and contingencies
Shareholder’s equity:
Capital stock
Common stock
Preferred stock
Capital surplus
Paid-in capital in excess of par value
Other capital surplus
Retained earnings
(Net income of ₩7,051,761 million in 2002
and ₩2,964,935 million in 2001)
Capital adjustments:
Treasury stock
Others
TOTAL SHAREHOLDERS’ EQUITY
TOTAL LIABILITIES AND SHAREHOLDERS’ EQUITY
December 31, 2002 and 2001