Salesforce.com 2011 Annual Report Download - page 91
Download and view the complete annual report
Please find page 91 of the 2011 Salesforce.com annual report below. You can navigate through the pages in the report by either clicking on the pages listed below, or by using the keyword search tool below to find specific information within the annual report.-
 1
1 -
2
-
3
-
4
-
5
-
6
-
7
-
8
-
9
-
10
-
11
-
12
-
13
-
14
-
15
-
16
-
17
-
18
-
19
-
20
-
21
-
22
-
23
-
24
-
25
-
26
-
27
-
28
-
29
-
30
-
31
-
32
-
33
-
34
-
35
-
36
-
37
-
38
-
39
-
40
-
41
-
42
-
43
-
44
-
45
-
46
-
47
-
48
-
49
-
50
-
51
-
52
-
53
-
54
-
55
-
56
-
57
-
58
-
59
-
60
-
61
-
62
-
63
-
64
-
65
-
66
-
67
-
68
-
69
-
70
-
71
-
72
-
73
-
74
-
75
-
76
-
77
-
78
-
79
-
80
-
 81
81 -
 82
82 -
 83
83 -
 84
84 -
 85
85 -
 86
86 -
 87
87 -
 88
88 -
 89
89 -
 90
90 -
 91
91 -
 92
92 -
 93
93 -
 94
94 -
 95
95 -
 96
96 -
 97
97 -
 98
98 -
 99
99 -
 100
100 -
 101
101 -
102
-
103
-
104
-
105
-
106
-
107
-
108
 |
 |

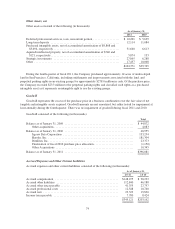
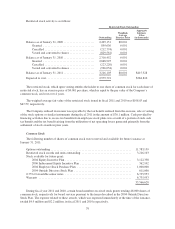
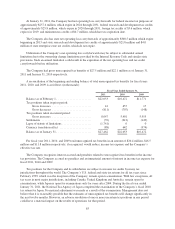
Intangible assets acquired resulting from the acquisitions described above as of January 31, 2011 are as
follows (in thousands):
Gross
Fair Value
Accumulated
Amortization
Net
Book Value
Weighted
Average Remaining
Useful Life
Acquired developed technology ....... $86,710 $ (9,324) $77,386 2.7 years
Customer relationships .............. 2,990 (412) 2,578 4.3 years
Trade name and trademark ........... 2,920 (557) 2,363 2.4 years
$92,620 $(10,293) $82,327
The expected future amortization expense for these intangible assets for each of the fiscal years ended
thereafter is as follows (in thousands):
Fiscal Period:
Fiscal 2012 ................................................................ $30,475
Fiscal 2013 ................................................................ 30,475
Fiscal 2014 ................................................................ 20,598
Fiscal 2015 ................................................................ 598
Fiscal 2016 ................................................................ 181
Total amortization expense ................................................... $82,327
Pro forma results of operations have not been presented because the effect of the acquisitions individually or
in the aggregate were not significant.
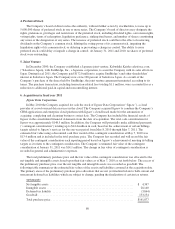
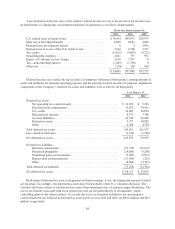
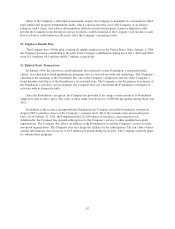
7. Income Taxes
The domestic and foreign components of income before provision for income taxes and noncontrolling
interest consisted of the following (in thousands):
Fiscal Year Ended January 31,
2011 2010 2009
Domestic ............................................. $ 75,515 $125,095 $83,590
Foreign .............................................. 28,783 17,286 2,002
$104,298 $142,381 $85,592
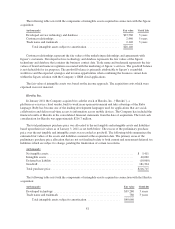
The provision for income taxes consisted of the following (in thousands):
Fiscal Year Ended January 31,
2011 2010 2009
Current:
Federal ........................................... $29,992 $43,313 $ 55,228
State ............................................. 6,276 8,788 7,701
Foreign ........................................... 13,239 12,179 7,699
Total ............................................. 49,507 64,280 70,628
Deferred:
Federal ........................................... (8,687) (4,506) (26,979)
State ............................................. (4,745) (979) (5,372)
Foreign ........................................... (1,474) (1,106) (720)
Total ............................................. (14,906) (6,591) (33,071)
Provision for income taxes ........................... $34,601 $57,689 $ 37,557
83