Salesforce.com 2011 Annual Report Download - page 56
Download and view the complete annual report
Please find page 56 of the 2011 Salesforce.com annual report below. You can navigate through the pages in the report by either clicking on the pages listed below, or by using the keyword search tool below to find specific information within the annual report.-
 1
1 -
2
-
3
-
4
-
5
-
6
-
7
-
8
-
9
-
10
-
11
-
12
-
13
-
14
-
15
-
16
-
17
-
18
-
19
-
20
-
21
-
22
-
23
-
24
-
25
-
26
-
27
-
28
-
29
-
30
-
31
-
32
-
33
-
34
-
35
-
36
-
37
-
38
-
39
-
40
-
41
-
42
-
43
-
44
-
45
-
 46
46 -
 47
47 -
 48
48 -
 49
49 -
 50
50 -
 51
51 -
 52
52 -
 53
53 -
 54
54 -
 55
55 -
 56
56 -
 57
57 -
 58
58 -
 59
59 -
 60
60 -
 61
61 -
 62
62 -
 63
63 -
 64
64 -
 65
65 -
 66
66 -
67
-
68
-
69
-
70
-
71
-
72
-
73
-
74
-
75
-
76
-
77
-
78
-
79
-
80
-
81
-
82
-
83
-
84
-
85
-
86
-
87
-
88
-
89
-
90
-
91
-
92
-
93
-
94
-
95
-
96
-
97
-
98
-
99
-
100
-
101
-
102
-
103
-
104
-
105
-
106
-
107
-
108
 |
 |

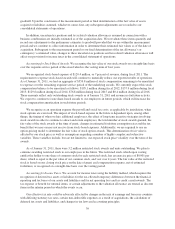
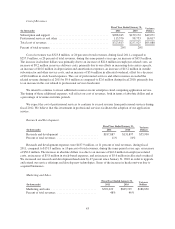
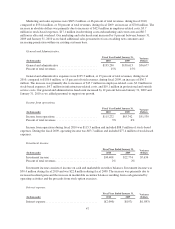
Interest expense consists primarily of interest on our capital leases. Interest expense was $2.0 million during
fiscal 2010 and was $0.1 million during fiscal 2009. The increase was primarily due to capital leases associated
with equipment in expanding our data center capacity.
Other expense.
Fiscal Year Ended January 31, Variance
Dollars(In thousands) 2010 2009
Other expense .................................... $(1,299) $(817) $(482)
Other expense primarily consists of foreign currency translation gains and losses. Other expense increased
due to realized and unrealized gains on foreign currency translations for fiscal 2010 compared to fiscal 2009.
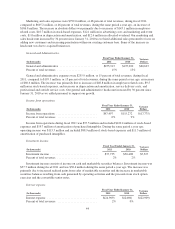
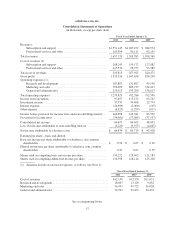
Provision for Income Taxes.
Fiscal Year Ended January 31,
(In thousands) 2010 2009 Dollars
Provision for income taxes .......................... $(57,689) $(37,557) $(20,132)
Effective tax rate .................................. 41% 44%
The provision for income taxes was $57.7 million during fiscal 2010, compared to $37.6 million during
fiscal 2009.
Our effective tax rate decreased to 41 percent for fiscal 2010 compared to 44 percent for fiscal 2009. The
decrease was due to a higher proportion of income being generated in countries with lower income tax rates than
the U.S. statutory tax rate as well as increased tax credits. The total income tax benefit recognized in the
accompanying consolidated statements of operations related to stock-based compensation was $32.1 million for
fiscal 2010.
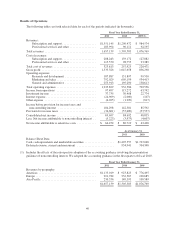
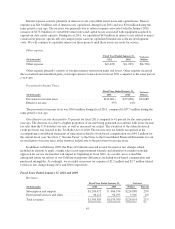
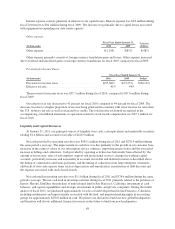
Liquidity and Capital Resources
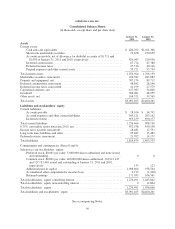
At January 31, 2011, our principal sources of liquidity were cash, cash equivalents and marketable securities
totaling $1.4 billion and accounts receivable of $426.9 million.
Net cash provided by operating activities was $459.1 million during fiscal 2011 and $270.9 million during
the same period a year ago. The improvement in cash flow was due primarily to the growth in our customer base,
increases in the contract values of our subscription service contracts, improving renewal rates and the associated
increase in billings and collections. Cash provided by operating activities has historically been affected by: the
amount of net income; sales of subscriptions, support and professional services; changes in working capital
accounts, particularly increases and seasonality in accounts receivable and deferred revenue as described above,
the timing of commission and bonus payments, and the timing of collections from large enterprise customers;
add-backs of non-cash expense items such as depreciation and amortization, amortization of debt discount and
the expense associated with stock-based awards.
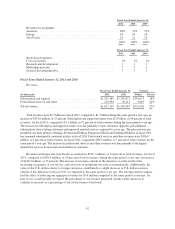
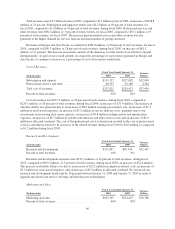
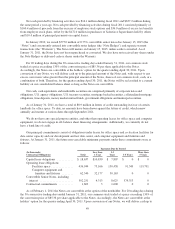
Net cash used in investing activities was $1.1 billion during fiscal 2011 and $378.6 million during the same
period a year ago. The net cash used in investing activities during fiscal 2011 primarily related to the purchase of
Jigsaw, Heroku, DimDim, the purchase of undeveloped land in San Francisco, California, investment of cash
balances, and capital expenditures and strategic investments in public and private companies. During the fourth
quarter of fiscal 2011, we purchased approximately 14 acres of undeveloped land in San Francisco, California,
including entitlements and improvements associated with the land, and perpetual parking rights in an existing
garage for approximately $278.0 million in cash. We plan to use the land to build our new global headquarters
and therefore will devote additional financial resources in the future to build our new headquarters.
48