Salesforce.com 2011 Annual Report Download - page 71
Download and view the complete annual report
Please find page 71 of the 2011 Salesforce.com annual report below. You can navigate through the pages in the report by either clicking on the pages listed below, or by using the keyword search tool below to find specific information within the annual report.-
 1
1 -
2
-
3
-
4
-
5
-
6
-
7
-
8
-
9
-
10
-
11
-
12
-
13
-
14
-
15
-
16
-
17
-
18
-
19
-
20
-
21
-
22
-
23
-
24
-
25
-
26
-
27
-
28
-
29
-
30
-
31
-
32
-
33
-
34
-
35
-
36
-
37
-
38
-
39
-
40
-
41
-
42
-
43
-
44
-
45
-
46
-
47
-
48
-
49
-
50
-
51
-
52
-
53
-
54
-
55
-
56
-
57
-
58
-
59
-
60
-
 61
61 -
 62
62 -
 63
63 -
 64
64 -
 65
65 -
 66
66 -
 67
67 -
 68
68 -
 69
69 -
 70
70 -
 71
71 -
 72
72 -
 73
73 -
 74
74 -
 75
75 -
 76
76 -
 77
77 -
 78
78 -
 79
79 -
 80
80 -
 81
81 -
82
-
83
-
84
-
85
-
86
-
87
-
88
-
89
-
90
-
91
-
92
-
93
-
94
-
95
-
96
-
97
-
98
-
99
-
100
-
101
-
102
-
103
-
104
-
105
-
106
-
107
-
108
 |
 |

The following table presents the Company’s liabilities measured at fair value using significant unobservable
inputs (Level 3) at January 31, 2011. These liabilities consist of the Company’s contingent considerations related
to acquisitions. During fiscal 2011, the Company recorded the fair value of the Company’s contingent
considerations using a discounted cash flow model (in thousands):
Balance at February 1, 2010 ............................................................ $ 0
Additions .......................................................................... 17,138
Balance at January 31, 2011 ............................................................ $17,138
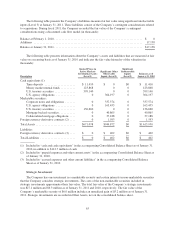
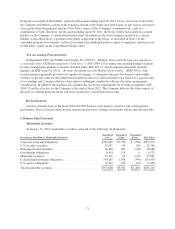
The following table presents information about the Company’s assets and liabilities that are measured at fair
value on a recurring basis as of January 31, 2010 and indicates the fair value hierarchy of the valuation (in
thousands):
Description
Quoted Prices in
Active Markets
for Identical Assets
(Level 1)
Significant Other
Observable
Inputs (Level 2)
Significant
Unobservable
Inputs
(Level 3)
Balances as of
January 31, 2010
Cash equivalents (1):
Time deposits ..................... $ 11,410 $ 0 $0 $ 11,410
Money market mutual funds .......... 123,868 0 0 123,868
U.S. treasury securities .............. 399,140 0 0 399,140
U.S. agency obligations ............. 0 364,197 0 364,197
Marketable securities:
Corporate notes and obligations ....... 0 337,574 0 337,574
U.S. agency obligations ............. 0 163,455 0 163,455
U.S. treasury securities .............. 136,660 0 0 136,660
Mortgage backed securities ........... 0 40,865 0 40,865
Collateralized mortgage obligations .... 0 37,188 0 37,188
Foreign currency derivative contracts (2) .... 0 1,593 0 1,593
Total Assets ........................... $671,078 $944,872 $0 $1,615,950
Liabilities
Foreign currency derivative contracts (3) .... $ 0 $ 402 $0 $ 402
Total Liabilities ........................ $ 0 $ 402 $0 $ 402
(1) Included in “cash and cash equivalents” in the accompanying Consolidated Balance Sheet as of January 31,
2010, in addition to $112.7 million of cash.
(2) Included in “prepaid expenses and other current assets” in the accompanying Consolidated Balance Sheet as
of January 31, 2010.
(3) Included in “accrued expenses and other current liabilities” in the accompanying Consolidated Balance
Sheet as of January 31, 2010.
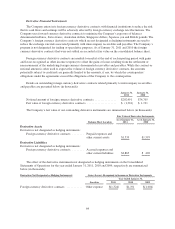
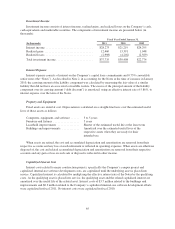
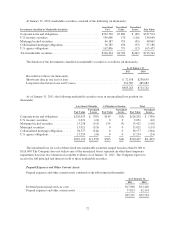
Strategic Investments
The Company has one investment in a marketable security and certain interests in non-marketable securities
that the Company considers strategic investments. The costs of the non-marketable securities included in
strategic investments approximates their fair value. The total fair value of the Company’s strategic investments
was $27.1 million and $6.3 million as of January 31, 2011 and 2010, respectively. The fair value of the
Company’s marketable security of $6.0 million includes an unrealized gain of $5.2 million as of January 31,
2011. Strategic investments are recorded in Other Assets, net on the consolidated balance sheet.
63