Salesforce.com 2011 Annual Report Download - page 70
Download and view the complete annual report
Please find page 70 of the 2011 Salesforce.com annual report below. You can navigate through the pages in the report by either clicking on the pages listed below, or by using the keyword search tool below to find specific information within the annual report.-
 1
1 -
2
-
3
-
4
-
5
-
6
-
7
-
8
-
9
-
10
-
11
-
12
-
13
-
14
-
15
-
16
-
17
-
18
-
19
-
20
-
21
-
22
-
23
-
24
-
25
-
26
-
27
-
28
-
29
-
30
-
31
-
32
-
33
-
34
-
35
-
36
-
37
-
38
-
39
-
40
-
41
-
42
-
43
-
44
-
45
-
46
-
47
-
48
-
49
-
50
-
51
-
52
-
53
-
54
-
55
-
56
-
57
-
58
-
59
-
 60
60 -
 61
61 -
 62
62 -
 63
63 -
 64
64 -
 65
65 -
 66
66 -
 67
67 -
 68
68 -
 69
69 -
 70
70 -
 71
71 -
 72
72 -
 73
73 -
 74
74 -
 75
75 -
 76
76 -
 77
77 -
 78
78 -
 79
79 -
 80
80 -
81
-
82
-
83
-
84
-
85
-
86
-
87
-
88
-
89
-
90
-
91
-
92
-
93
-
94
-
95
-
96
-
97
-
98
-
99
-
100
-
101
-
102
-
103
-
104
-
105
-
106
-
107
-
108
 |
 |

The Company measures its cash equivalents, marketable securities, foreign currency derivative contracts
and contingent considerations related to acquisitions at fair value. All of the Company’s cash equivalents,
marketable securities and foreign currency derivative contracts are classified within Level 1 or Level 2, which
are described below. This is because the Company’s cash equivalents, marketable securities and foreign currency
derivative contracts are valued using quoted market prices or alternative pricing sources and models utilizing
market observable inputs.
The Company established a three-tier fair value hierarchy, which prioritizes the inputs used in the valuation
methodologies in measuring fair value:
Level 1. Observable inputs that reflect quoted prices (unadjusted) for identical assets or
liabilities in active markets.
Level 2. Include other inputs that are directly or indirectly observable in the marketplace.
Level 3. Unobservable inputs which are supported by little or no market activity.
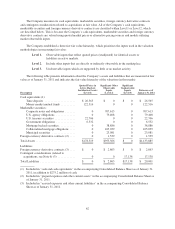
The following table presents information about the Company’s assets and liabilities that are measured at fair
value as of January 31, 2011 and indicates the fair value hierarchy of the valuation (in thousands):
Description
Quoted Prices in
Active Markets
for Identical Assets
(Level 1)
Significant Other
Observable
Inputs
(Level 2)
Significant
Unobservable
Inputs
(Level 3)
Balances as of
January 31, 2011
Cash equivalents (1):
Time deposits ..................... $ 26,565 $ 0 $ 0 $ 26,565
Money market mutual funds .......... 122,516 0 0 122,516
Marketable securities:
Corporate notes and obligations ....... 0 707,613 0 707,613
U.S. agency obligations ............. 0 79,408 0 79,408
U.S. treasury securities .............. 22,706 0 0 22,706
Government obligations ............. 6,532 0 0 6,532
Mortgage backed securities ........... 0 38,886 0 38,886
Collateralized mortgage obligations .... 0 105,039 0 105,039
Municipal securities ................ 0 23,081 0 23,081
Foreign currency derivative contracts (2) .... 0 1,539 0 1,539
Total Assets ........................... $178,319 $955,566 $ 0 $1,133,885
Liabilities
Foreign currency derivative contracts (3) .... $ 0 $ 2,863 $ 0 $ 2,863
Contingent considerations (related to
acquisitions, see Note 6) (3) ............ 0 0 17,138 17,138
Total Liabilities ........................ $ 0 $ 2,863 $17,138 $ 20,001
(1) Included in “cash and cash equivalents” in the accompanying Consolidated Balance Sheet as of January 31,
2011, in addition to $275.2 million of cash.
(2) Included in “prepaid expenses and other current assets” in the accompanying Consolidated Balance Sheet as
of January 31, 2011.
(3) Included in “accrued expenses and other current liabilities” in the accompanying Consolidated Balance
Sheet as of January 31, 2011.
62