Salesforce.com 2011 Annual Report Download - page 86
Download and view the complete annual report
Please find page 86 of the 2011 Salesforce.com annual report below. You can navigate through the pages in the report by either clicking on the pages listed below, or by using the keyword search tool below to find specific information within the annual report.-
 1
1 -
2
-
3
-
4
-
5
-
6
-
7
-
8
-
9
-
10
-
11
-
12
-
13
-
14
-
15
-
16
-
17
-
18
-
19
-
20
-
21
-
22
-
23
-
24
-
25
-
26
-
27
-
28
-
29
-
30
-
31
-
32
-
33
-
34
-
35
-
36
-
37
-
38
-
39
-
40
-
41
-
42
-
43
-
44
-
45
-
46
-
47
-
48
-
49
-
50
-
51
-
52
-
53
-
54
-
55
-
56
-
57
-
58
-
59
-
60
-
61
-
62
-
63
-
64
-
65
-
66
-
67
-
68
-
69
-
70
-
71
-
72
-
73
-
74
-
75
-
 76
76 -
 77
77 -
 78
78 -
 79
79 -
 80
80 -
 81
81 -
 82
82 -
 83
83 -
 84
84 -
 85
85 -
 86
86 -
 87
87 -
 88
88 -
 89
89 -
 90
90 -
 91
91 -
 92
92 -
 93
93 -
 94
94 -
 95
95 -
 96
96 -
97
-
98
-
99
-
100
-
101
-
102
-
103
-
104
-
105
-
106
-
107
-
108
 |
 |

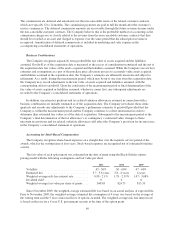
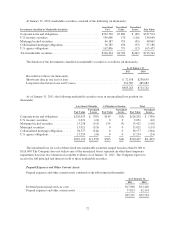
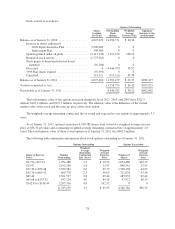
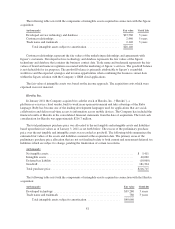
Stock activity is as follows:
Shares
Available
for Grant
Options Outstanding
Outstanding
Stock
Options
Weighted-
Average
Exercise Price
Aggregate
Intrinsic Value
(in thousands)
Balance as of January 31, 2010 .................... 4,607,929 14,036,371 $ 40.36
Increase in shares authorized:
2004 Equity Incentive Plan ............... 3,500,000 0 0
Inducement Plan ........................ 300,000 0 0
Options granted under all plans ................ (3,113,276) 3,113,276 128.33
Restricted stock activity ...................... (1,775,505) 0 0
Stock grants to board and advisory board
members ................................ (50,200) 0 0
Exercised ................................. 0 (4,646,977) 34.52
1999 Plan shares expired ..................... (92,999) 0 0
Cancelled ................................. 719,511 (719,511) 49.38
Balance as of January 31, 2011 .................... 4,095,460 11,783,159 $ 65.35 $782,437
Vested or expected to vest ........................ 11,358,774 $ 64.42 $763,923
Exercisable as of January 31, 2011 ................. 4,340,782 $ 36.32 $402,892
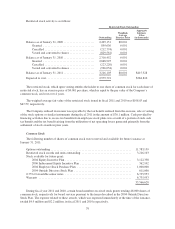
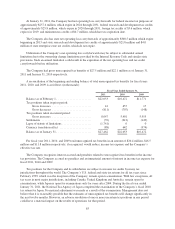
The total intrinsic value of the options exercised during the fiscal 2011, 2010, and 2009 were $322.5
million, $105.2 million, and $117.3 million, respectively. The intrinsic value is the difference of the current
market value of the stock and the exercise price of the stock option.
The weighted-average remaining contractual life of vested and expected to vest options is approximately 3.3
years.
As of January 31, 2011, options to purchase 4,340,782 shares were vested at a weighted average exercise
price of $36.32 per share and a remaining weighted-average remaining contractual life of approximately 2.6
years. The total intrinsic value of these vested options as of January 31, 2011 was $402.9 million.
The following table summarizes information about stock options outstanding as of January 31, 2011:
Options Outstanding Options Exercisable
Range of Exercise
Prices
Number
Outstanding
Weighted-
Average
Remaining
Contractual
Life (Years)
Weighted-
Average
Exercise
Price
Number of
Shares
Weighted-
Average
Exercise
Price
$0.75 to $25.19 1,054,480 3.2 $ 10.29 1,054,480 $10.29
$25.97 2,195,260 2.8 25.97 848,361 25.97
$27.20 to $52.48 2,309,582 2.0 45.79 1,528,138 44.65
$52.76 to $65.41 669,778 2.5 56.09 321,878 55.38
$65.44 2,301,557 3.8 65.44 489,953 65.44
$65.68 to $133.32 957,126 4.0 84.78 97,972 68.15
$142.50 to $148.49 2,295,376 4.8 142.52 0 0
11,783,159 3.3 $ 65.35 4,340,782 $36.32
78