Salesforce.com 2011 Annual Report Download - page 80
Download and view the complete annual report
Please find page 80 of the 2011 Salesforce.com annual report below. You can navigate through the pages in the report by either clicking on the pages listed below, or by using the keyword search tool below to find specific information within the annual report.-
 1
1 -
2
-
3
-
4
-
5
-
6
-
7
-
8
-
9
-
10
-
11
-
12
-
13
-
14
-
15
-
16
-
17
-
18
-
19
-
20
-
21
-
22
-
23
-
24
-
25
-
26
-
27
-
28
-
29
-
30
-
31
-
32
-
33
-
34
-
35
-
36
-
37
-
38
-
39
-
40
-
41
-
42
-
43
-
44
-
45
-
46
-
47
-
48
-
49
-
50
-
51
-
52
-
53
-
54
-
55
-
56
-
57
-
58
-
59
-
60
-
61
-
62
-
63
-
64
-
65
-
66
-
67
-
68
-
69
-
 70
70 -
 71
71 -
 72
72 -
 73
73 -
 74
74 -
 75
75 -
 76
76 -
 77
77 -
 78
78 -
 79
79 -
 80
80 -
 81
81 -
 82
82 -
 83
83 -
 84
84 -
 85
85 -
 86
86 -
 87
87 -
 88
88 -
 89
89 -
 90
90 -
91
-
92
-
93
-
94
-
95
-
96
-
97
-
98
-
99
-
100
-
101
-
102
-
103
-
104
-
105
-
106
-
107
-
108
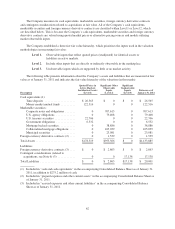
 |
 |

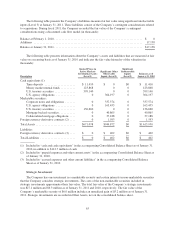
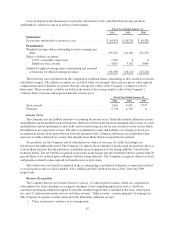
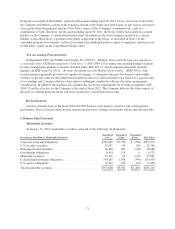
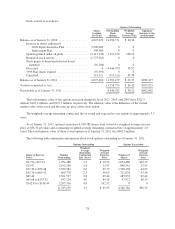
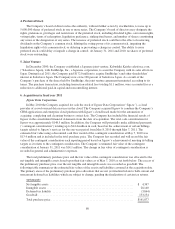
At January 31, 2010, marketable securities consisted of the following (in thousands):
Investments classified as Marketable Securities
Amortized
Cost
Unrealized
Gains
Unrealized
Losses Fair Value
Corporate notes and obligations ........................... $329,750 $7,889 $ (65) $337,574
U.S. treasury securities .................................. 136,606 170 (116) 136,660
Mortgage backed securities ............................... 40,187 719 (41) 40,865
Collateralized mortgage obligations ........................ 36,785 436 (33) 37,188
U.S. agency obligations .................................. 162,896 571 (12) 163,455
Total marketable securities ............................... $706,224 $9,785 $(267) $715,742
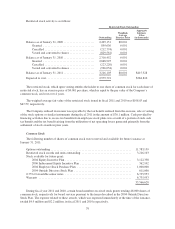
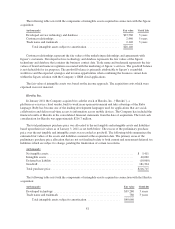
The duration of the investments classified as marketable securities is as follows (in thousands):
As of January 31,
2011 2010
Recorded as follows (in thousands):
Short-term (due in one year or less) ................................. $ 72,678 $230,659
Long-term (due between one and 3 years) ............................ 910,587 485,083
$983,265 $715,742
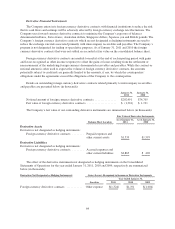
As of January 31, 2011, the following marketable securities were in an unrealized loss position (in
thousands):
Less than 12 Months 12 Months or Greater Total
Fair Value
Unrealized
Losses Fair Value
Unrealized
Losses Fair Value
Unrealized
Losses
Corporate notes and obligations ........ $126,053 $ (787) $149 $(3) $126,202 $ (790)
U.S. treasury securities ............... 2,031 (10) 0 0 2,031 (10)
Mortgage backed securities ............ 13,258 (115) 154 (3) 13,412 (118)
Municipal securities .................. 13,021 (119) 0 0 13,021 (119)
Collateralized mortgage obligations ..... 38,577 (344) 0 0 38,577 (344)
U.S. agency obligations ............... 17,254 (24) 0 0 17,254 (24)
$210,194 $(1,399) $303 $(6) $210,497 $(1,405)
The unrealized loss for each of these fixed rate marketable securities ranged from less than $1,000 to
$116,000. The Company does not believe any of the unrealized losses represent an other-than-temporary
impairment based on its evaluation of available evidence as of January 31, 2011. The Company expects to
receive the full principal and interest on all of these marketable securities.
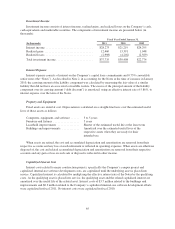
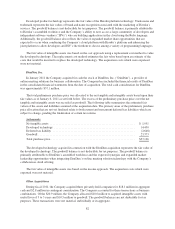
Prepaid Expenses and Other Current Assets
Prepaid expenses and other current assets consisted of the following (in thousands):
As of January 31,
2011 2010
Deferred professional services costs ................................... $17,908 $13,420
Prepaid expenses and other current assets .............................. 37,813 42,314
$55,721 $55,734
72