Safeway 2005 Annual Report Download - page 41
Download and view the complete annual report
Please find page 41 of the 2005 Safeway annual report below. You can navigate through the pages in the report by either clicking on the pages listed below, or by using the keyword search tool below to find specific information within the annual report.-
 1
1 -
2
-
3
-
4
-
5
-
6
-
7
-
8
-
9
-
10
-
11
-
12
-
13
-
14
-
15
-
16
-
17
-
18
-
19
-
20
-
21
-
22
-
23
-
24
-
25
-
26
-
27
-
28
-
29
-
30
-
 31
31 -
 32
32 -
 33
33 -
 34
34 -
 35
35 -
 36
36 -
 37
37 -
 38
38 -
 39
39 -
 40
40 -
 41
41 -
 42
42 -
 43
43 -
 44
44 -
 45
45 -
 46
46 -
 47
47 -
 48
48 -
 49
49 -
 50
50 -
 51
51 -
52
-
53
-
54
-
55
-
56
-
57
-
58
-
59
-
60
-
61
-
62
-
63
-
64
-
65
-
66
-
67
-
68
-
69
-
70
-
71
-
72
-
73
-
74
-
75
-
76
-
77
-
78
-
79
-
80
-
81
-
82
-
83
-
84
-
85
-
86
-
87
-
88
-
89
-
90
-
91
-
92
-
93
-
94
-
95
-
96
 |
 |
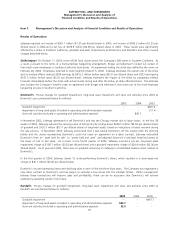
SAFEWAY INC. AND SUBSIDIARIES
Management’s Discussion and Analysis of
Financial Condition and Results of Operations
21
the period, including purchase and distribution costs. These costs include inbound freight charges, purchasing and receiving
costs, warehouse inspection costs, warehousing costs, and other costs of Safeway’s distribution network. Advertising and
promotional expenses are also a component of cost of goods sold. Additionally, all vendor allowances are classified as an
element of cost of goods sold.
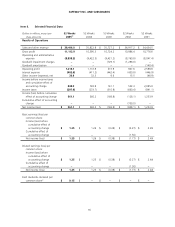
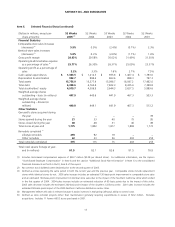
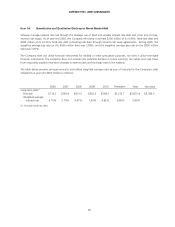
Gross profit margin was 28.93% of sales in 2005, 29.58% in 2004, and 30.02% in 2003.
The gross profit margin decreased 65 basis points to 28.93% of sales in 2005 from 29.58% in 2004. Higher fuel sales
reduced gross profit by 39 basis points. The remaining decline is due to grand openings of Lifestyle stores, investment in
price, increased advertising expense and higher energy costs.
Gross profit declined 44 basis points in 2004. The strike in Southern California reduced gross profit by an estimated 41 basis
points, and higher fuel sales (which have a lower gross margin) reduced gross profit by 40 basis points. Gross profit in 2003
was reduced by 20 basis points due to the $71.0 million charge to accrue estimated inventory losses and a change in
estimate for inventory markdowns. The remaining 17-basis-point increase was primarily the result of targeted pricing and
promotion.
Gross profit declined 147 basis points in 2003. Higher fuel sales reduced gross profit by 38 basis points. The $71.0 million in
inventory charges reduced gross profit 20 basis points. The strike in Southern California reduced gross profit by an estimated
five basis points. The remaining 84-basis-point decline was primarily the result of targeted pricing and promotion.
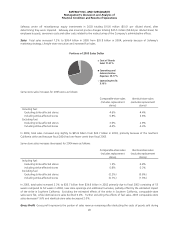
Vendor allowances totaled $2.4 billion in 2005 and $2.2 billion each in 2004 and 2003. Vendor allowances can be grouped
into the following broad categories: promotional allowances, slotting allowances and contract allowances. All vendor
allowances are classified as an element of cost of goods sold.
Promotional allowances make up nearly three-quarters of all allowances. With promotional allowances, vendors pay Safeway
to promote their product. The promotion may be any combination of a temporary price reduction, a feature in print ads, a
feature in a Safeway circular, or a preferred location in the store. The promotions are typically one to two weeks long.
Slotting allowances are a small portion of total allowances (typically less than 5% of all allowances). With slotting
allowances, the vendor reimburses Safeway for the cost of placing new product on the shelf. Safeway has no obligation or
commitment to keep the product on the shelf for a minimum period.
Contract allowances make up the remainder of all allowances. Under the typical contract allowance, a vendor pays Safeway
to keep product on the shelf for a minimum period of time or when volume thresholds are achieved.
Operating and Administrative Expense Operating and administrative expense consists primarily of store occupancy costs
and backstage expenses, which, in turn, consist primarily of wages, employee benefits, rent, depreciation and utilities.
Operating and administrative expense was 25.77% of sales in 2005 compared to 26.30% in 2004 and 26.37% in 2003.
Operating and administrative expense decreased 53 basis points in 2005 to 25.77% of sales from 26.30% in 2004. The
significant pre-tax charges discussed above (impairment of long-lived assets, store exit activities and employee buyouts in
2005 combined with store exit activities, health and welfare contributions and the accrual for rent holidays in 2004)
increased operating and administrative expense, as a percentage of sales, by 20 basis points. Stock option expense, labor
costs associated with the grand opening of Lifestyle stores and higher energy costs also increased operating and
administrative expense, as a percentage of sales. These items were more than offset by the restructured labor agreements,
increased fuel sales and reduced workers’ compensation costs.
Operating and administrative expense decreased seven basis points in 2004. Lower impairment charges reduced operating
and administrative expense as a percentage of sales by 77 basis points and higher fuel sales reduced operating and
administrative expense by 39 basis points. These improvements were offset by a 22-basis-point increase from the strike in
Southern California and 87 basis points due to higher wages, benefits and occupancy expense.