Safeway 2005 Annual Report Download - page 37
Download and view the complete annual report
Please find page 37 of the 2005 Safeway annual report below. You can navigate through the pages in the report by either clicking on the pages listed below, or by using the keyword search tool below to find specific information within the annual report.-
 1
1 -
2
-
3
-
4
-
5
-
6
-
7
-
8
-
9
-
10
-
11
-
12
-
13
-
14
-
15
-
16
-
17
-
18
-
19
-
20
-
21
-
22
-
23
-
24
-
25
-
26
-
 27
27 -
 28
28 -
 29
29 -
 30
30 -
 31
31 -
 32
32 -
 33
33 -
 34
34 -
 35
35 -
 36
36 -
 37
37 -
 38
38 -
 39
39 -
 40
40 -
 41
41 -
 42
42 -
 43
43 -
 44
44 -
 45
45 -
 46
46 -
 47
47 -
48
-
49
-
50
-
51
-
52
-
53
-
54
-
55
-
56
-
57
-
58
-
59
-
60
-
61
-
62
-
63
-
64
-
65
-
66
-
67
-
68
-
69
-
70
-
71
-
72
-
73
-
74
-
75
-
76
-
77
-
78
-
79
-
80
-
81
-
82
-
83
-
84
-
85
-
86
-
87
-
88
-
89
-
90
-
91
-
92
-
93
-
94
-
95
-
96
 |
 |

SAFEWAY INC. AND SUBSIDIARIES
17
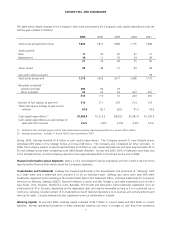
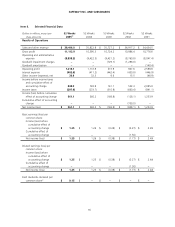
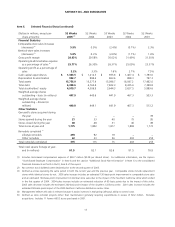
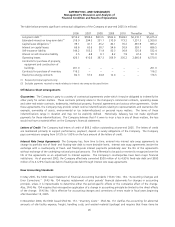
Item 6. Selected Financial Data (continued)
(Dollars in millions, except per-
share amounts)
52 Weeks
2005 (1)
52 Weeks
2004
53 Weeks
2003
52 Weeks
2002
52 Weeks
2001
Financial Statistics
Comparable-store sales increases
(decreases) (3) 5.9% 0.9% (2.4%) (0.7%) 2.3%
Identical-store sales increases
(decreases) (3) 5.8% 0.3% (2.8%) (1.7%) 1.6%
Gross profit margin 28.93% 29.58% 30.02% 31.49% 31.30%
Operating & administrative expense
as a percentage of sales (4) 25.77% 26.30% 26.37% 25.09% 23.37%
Operating profit as a percentage of
sales 3.2% 3.3% 1.6% 2.7% 7.5%
Cash capital expenditures $ 1,383.5 $ 1,212.5 $ 935.8 $ 1,467.4 $ 1,793.0
Depreciation & amortization 932.7 894.6 863.6 888.3 797.3
Total assets 15,756.9 15,377.4 15,096.7 16,047.2 17,462.6
Total debt 6,358.6 6,763.4 7,822.3 8,435.6 7,399.8
Total stockholders’ equity 4,919.7 4,306.9 3,644.3 3,627.5 5,889.6
Weighted average shares
outstanding – basic (in millions) 447.9 445.6 441.9 467.3 503.3
Weighted average shares
outstanding – diluted (in
millions) 449.8 449.1 441.9 467.3 513.2
Other Statistics
Genuardi’s stores acquired during
the year −−−−39
Stores opened during the year 21 33 40 75 95
Stores closed during the year 48 48 31 40 49
Total stores at year-end 1,775 1,802 1,817 1,808 1,773
Remodels completed (5)
Lifestyle remodels 293 92 19 −−
Other remodels 22 23 56 203 255
Total remodels completed 315 115 75 203 255
Total retail square footage at year-
end (in millions) 81.0 82.1 82.6 81.5 78.8
(1) Includes stock-based compensation expense of $59.7 million ($0.08 per diluted share). For additional information, see the caption
“Stock-Based Employee Compensation” in Note A and the caption “Additional Stock Plan Information” in Note G to the consolidated
financials statements set forth in Part II, Item 8 of this report.
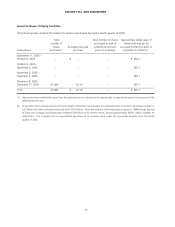
(2) No common stock dividends were declared prior to the second quarter of 2005.
(3) Defined as stores operating the same period in both the current year and the previous year. Comparable stores include replacement
stores while identical stores do not. 2005 sales increase includes an estimated 130-basis-point improvement in comparable store sales
and an estimated 140-basis-point improvement in identical store sales due to the impact of the Southern California strike which ended
in the first quarter of 2004. 2004 sales increase includes an estimated reduction of 60 basis points due to the impact of this strike.
2003 sales decrease includes the estimated 240-basis-point impact of the Southern California strike. 2001 sales increase includes the
estimated 50-basis-point impact of the 2000 Northern California distribution center strike.
(4) Management believes this ratio is relevant because it assists investors in evaluating Safeway’s ability to control costs.
(5) Defined as store remodel projects (other than maintenance) generally requiring expenditures in excess of $0.2 million. Excludes
acquisitions. Includes 11 former ABCO stores purchased in 2001.