Royal Caribbean Cruise Lines 2005 Annual Report Download - page 3
Download and view the complete annual report
Please find page 3 of the 2005 Royal Caribbean Cruise Lines annual report below. You can navigate through the pages in the report by either clicking on the pages listed below, or by using the keyword search tool below to find specific information within the annual report.-
 1
1 -
 2
2 -
 3
3 -
 4
4 -
 5
5 -
 6
6 -
 7
7 -
 8
8 -
 9
9 -
 10
10 -
 11
11 -
 12
12 -
 13
13 -
 14
14 -
15
-
16
-
17
-
18
-
19
-
20
-
21
-
22
-
23
-
24
-
25
-
26
-
27
-
28
-
29
-
30
-
31
-
32
-
33
-
34
-
35
-
36
-
37
-
38
-
39
-
40
-
41
-
42
-
43
-
44
-
45
-
46
-
47
-
48
 |
 |

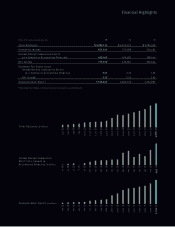
05(dollars in thousands, except per share data) 04 03
01
3,757
02
4,035
03
4,263
04
4,805
05
5,554
94
846
93
733
92
464
91
404
90
400
89
348
88
295
95
965
96
1,085
97
2,019
98
2,455
99
3,261
00
3,616
Total Revenues ($ millions)
01
3,145
02
3,434
03
3,784
04
4,555
05
4,903
88
523
89
567
90
698
91
760
92
1,013
93
1,113
94
1,171
95
1,184
96
1,357
97
1,939
98
2,636
99
2,546
00
2,866
01
254
02
351
03
281
04
475
05
663
89
42
88
14
90
52
91
4
92
61
93
107
94
137
95
149
96
151
97
175
99
384
98
331
00
445
Income Before Cumulative
Effect of a Change in
Accounting Principle ($ millions)
Shareholders’ Equity ($ millions)
Total Revenues
Operating Income
Income Before Cumulative Effect
of a Change in Accounting Principle
Net Income
Earnings Per Share (diluted)
Income Before Cumulative Effect
of a Change in Accounting Principle
Net Income
Shareholders’ Equity
$ 4,903,174
871,565
663,465
715,956
3.03
3.26
5,554,465
$ 4,555,375
753,589
474,691
474,691
2.26
2.26
4,804,520
$ 3,784,249
526,185
280,664
280,664
1.42
1.42
4,262,897
1
1
Financial Highlights
12005 includes $52.5 million, or $0.22 per share, due to a change in accounting principle.