Royal Caribbean Cruise Lines 2005 Annual Report Download - page 23
Download and view the complete annual report
Please find page 23 of the 2005 Royal Caribbean Cruise Lines annual report below. You can navigate through the pages in the report by either clicking on the pages listed below, or by using the keyword search tool below to find specific information within the annual report.-
 1
1 -
2
-
3
-
4
-
5
-
6
-
7
-
8
-
9
-
10
-
11
-
12
-
 13
13 -
 14
14 -
 15
15 -
 16
16 -
 17
17 -
 18
18 -
 19
19 -
 20
20 -
 21
21 -
 22
22 -
 23
23 -
 24
24 -
 25
25 -
 26
26 -
 27
27 -
 28
28 -
 29
29 -
 30
30 -
 31
31 -
 32
32 -
 33
33 -
34
-
35
-
36
-
37
-
38
-
39
-
40
-
41
-
42
-
43
-
44
-
45
-
46
-
47
-
48
 |
 |

ticket prices, occupancy levels and onboard revenues as consumer
sentiment towards leisure travel improved in 2004. During 2004,
Net Yields increased 9.2% and Net Cruise Costs per APCD increased
5.6% compared to 2003. Gross Cruise Costs increased 17.7% in
2004 compared to 2003 primarily as a result of increases in capacity,
commission expense associated with higher cruise ticket prices and
higher fuel prices. In addition, in 2004 we incurred costs of approx-
imately $11.3 million related to the impact of hurricanes.
Our revenues are seasonal based on demand for cruises. Demand is
strongest for cruises during the summer months and holidays.
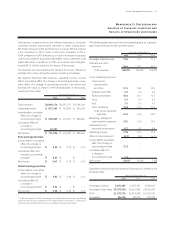
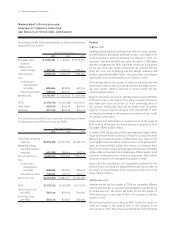
We reported historical total revenues, operating income, income
before cumulative effect of a change in accounting principle, cumu-
lative effect of a change in accounting principle, net income and
earnings per share as shown in the following table (in thousands,
except per share data):
Year Ended December 31,
2005 2004 2003
Total revenues $4,903,174 $4,555,375 $3,784,249
Operating income $ 871,565 $ 753,589 $ 526,185
Income before cumulative
effect of a change in
accounting principle $ 663,465 $ 474,691 $ 280,664
Cumulative effect of
a change in
accounting principle152,491 ––
Net income $ 715,956 $ 474,691 $ 280,664
Basic earnings per share:
Income before cumulative
effect of a change in
accounting principle $ 3.22 $ 2.39 $ 1.45
Cumulative effect of a
change in accounting
principle1$ 0.25 $–$–
Net income $ 3.47 $ 2.39 $ 1.45
Diluted earnings per share:
Income before cumulative
effect of a change in
accounting principle $ 3.03 $ 2.26 $ 1.42
Cumulative effect of
a change in
accounting principle1$ 0.22 $–$–
Net income $ 3.26 $ 2.26 $ 1.42
1In the third quarter of 2005, we changed our method of accounting for drydocking
costs from the accrual in advance to the deferral method (see Note 2.
Summary of
Significant Accounting Policies
to our consolidated financial statements).
The following table presents historical operating data as a percent-
age of total revenues for the last three years:
Year Ended December 31,
2005 2004 2003
Passenger ticket revenues 73.6 73.7 73.3
Onboard and other
revenues 26.4 26.3 26.7
Total revenues 100.0% 100.0% 100.0%
Cruise operating expenses
Commissions,
transportation
and other 17.5 18.1 18.1
Onboard and other 6.3 6.6 6.6
Payroll and related 10.4 10.7 11.3
Food 5.5 5.9 6.3
Fuel 7.5 5.5 5.2
Other operating 13.8 15.1 15.4
Total cruise operating
expenses 61.0 61.9 62.9
Marketing, selling and
administrative expenses 13.0 12.9 13.6
Depreciation and
amortization expenses 8.2 8.7 9.6
Operating income 17.8 16.5 13.9
Other income (expense) (4.3) (6.1) (6.5)
Income before cumulative
effect of a change in
accounting principle 13.5 ––
Cumulative effect of
a change in
accounting principle 1.1 ––
Net income 14.6% 10.4% 7.4%
Unaudited selected historical statistical information is shown in the
following table:
Year Ended December 31,
2005 2004 2003
Passengers Carried 3,476,287 3,405,227 2,990,607
Passenger Cruise Days 23,178,560 22,661,965 20,064,702
APCD 21,733,724 21,439,288 19,439,238
Occupancy 106.6% 105.7% 103.2%
Royal Caribbean Cruises Ltd. 21
Management’s Discussion and
Analysis of Financial Condition and
Results of Operations (continued)