Royal Caribbean Cruise Lines 2005 Annual Report Download - page 22
Download and view the complete annual report
Please find page 22 of the 2005 Royal Caribbean Cruise Lines annual report below. You can navigate through the pages in the report by either clicking on the pages listed below, or by using the keyword search tool below to find specific information within the annual report.-
 1
1 -
2
-
3
-
4
-
5
-
6
-
7
-
8
-
9
-
10
-
11
-
 12
12 -
 13
13 -
 14
14 -
 15
15 -
 16
16 -
 17
17 -
 18
18 -
 19
19 -
 20
20 -
 21
21 -
 22
22 -
 23
23 -
 24
24 -
 25
25 -
 26
26 -
 27
27 -
 28
28 -
 29
29 -
 30
30 -
 31
31 -
 32
32 -
33
-
34
-
35
-
36
-
37
-
38
-
39
-
40
-
41
-
42
-
43
-
44
-
45
-
46
-
47
-
48
 |
 |

Historical Results of Operations
. We have not provided a quantita-
tive reconciliation of projected Gross Yields to projected Net Yields
due to the significant uncertainty in projecting the costs deducted to
arrive at this measure. Accordingly, we do not believe that reconcil-
ing information for such projected figures would be meaningful.
Occupancy, in accordance with cruise vacation industry practice, is
calculated by dividing Passenger Cruise Days by APCD. A percentage
in excess of 100% indicates that three or more passengers occupied
some cabins.
Passenger Cruise Days represent the number of passengers carried
for the period multiplied by the number of days of their respective
cruises.
Overview
Our revenues consist of the following:
Passenger ticket revenues consist of revenue recognized from the
sale of passenger tickets and the sale of air transportation to our
ships.
Onboard and other revenues consist primarily of revenues from the
sale of goods and/or services onboard our ships, cancellation fees,
sales of vacation protection insurance and pre and post tours. Also
included are revenues we receive from independent third party
concessionaires that pay us a percentage of their revenues in
exchange for the right to provide selected goods and/or services
onboard our ships.
Our cruise operating expenses consist of the following:
Commissions, transportation and other expenses consist of those
costs directly associated with passenger ticket revenues, including
travel agent commissions, air and other transportation expenses,
port costs that vary with passenger head counts and related credit
card fees.
Onboard and other expenses consist of the direct costs associated
with onboard and other revenues. These costs include the cost of
products sold onboard our ships, vacation protection insurance pre-
miums, costs associated with pre and post tours and related credit
card fees. Concession revenues have minimal costs associated with
them, as the costs related to these activities are incurred by the con-
cessionaires.
Payroll and related expenses consist of costs for shipboard
personnel.
Food expenses include food costs for both passengers and crew.
Fuel expenses include fuel costs, net of the financial impact of
fuel swap agreements, and fuel delivery costs.
Other operating expenses consist of operating costs such as repairs
and maintenance, port costs that do not vary with passenger head
counts, insurance, entertainment and all other operating costs.
We do not allocate payroll and related costs, food costs, fuel costs
or other operating costs to the expense categories attributable to
passenger ticket revenues or onboard and other revenues since they
are incurred to provide the total cruise vacation experience.
We have operated under an exceptionally strong demand environ-
ment over the past two years, comparable to pre-9/11 levels. In
addition, the rate of capacity growth within the industry decreased
significantly to approximately 4.5% in 2005 from approximately
13.2% in 2004. These trends contributed to a favorable pricing envi-
ronment for our products and allowed us to achieve significant Net
Yield increases in 2005. In contrast, increasing fuel costs represent-
ed a significant challenge for us during 2005. Record crude oil
prices, combined with refining capacity shortfalls, helped to
increase “at the pump” prices to record levels. Although price and
consumption related initiatives partially mitigated these increases,
fuel costs on an APCD basis increased 44% during 2005 as com-
pared to 2004. Despite the significant increases in fuel costs, we
achieved the best financial performance in our history.
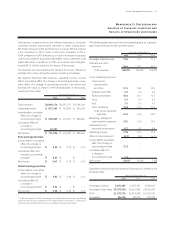
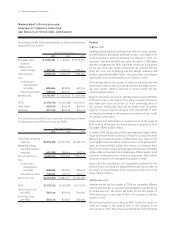
Highlights for 2005 included:
•Income before cumulative effect of a change in accounting prin-
ciple was $663.5 million or $3.03 per share on a diluted basis
in 2005 compared to $474.7 million or $2.26 per share in 2004
and $280.7 million or $1.42 per share in 2003. Included in our
results for 2005 is a net gain of $44.2 million, primarily due to
foreign exchange, on the redemption of our investment in First
Choice Holiday PLC (“First Choice”).
•Total revenues for 2005 increased 7.6% to $4.9 billion from
total revenues of $4.6 billion in 2004 primarily as a result of
increases in ticket prices. In addition, Net Yields increased 7.4%
compared to 2004.
•Net Cruise Costs per APCD increased 6.3% compared to 2004
primarily as a result of increases in the cost of fuel during the
year.
•In the third quarter of 2005, we changed our method of
accounting for drydocking costs from the accrual in advance
method to the deferral method, resulting in a one-time gain of
$52.5 million (see Note 2.
Summary of Significant Accounting
Policies
to our consolidated financial statements). Other than
this one-time gain, the change did not have a material impact
on our consolidated statement of operations.
•We strengthened our balance sheet in 2005 by reducing our net
debt-to-capital ratio to 42.0% in 2005 from 51.5% in 2004.
•During 2005 and through February 2006, we placed four addi-
tional ship orders, bringing our total number of ships on order
to six for an additional capacity of approximately 22,050 berths.
Total revenues for 2004 increased 20.4% to $4.6 billion from total
revenues of $3.8 billion in 2003. The increase in total revenues was a
result of a 10.3% increase in capacity along with increases in cruise
20 Royal Caribbean Cruises Ltd.
Management’s Discussion and
Analysis of Financial Condition
and Results of Operations (continued)