Regions Bank 2008 Annual Report Download - page 88
Download and view the complete annual report
Please find page 88 of the 2008 Regions Bank annual report below. You can navigate through the pages in the report by either clicking on the pages listed below, or by using the keyword search tool below to find specific information within the annual report.-
 1
1 -
2
-
3
-
4
-
5
-
6
-
7
-
8
-
9
-
10
-
11
-
12
-
13
-
14
-
15
-
16
-
17
-
18
-
19
-
20
-
21
-
22
-
23
-
24
-
25
-
26
-
27
-
28
-
29
-
30
-
31
-
32
-
33
-
34
-
35
-
36
-
37
-
38
-
39
-
40
-
41
-
42
-
43
-
44
-
45
-
46
-
47
-
48
-
49
-
50
-
51
-
52
-
53
-
54
-
55
-
56
-
57
-
58
-
59
-
60
-
61
-
62
-
63
-
64
-
65
-
66
-
67
-
68
-
69
-
70
-
71
-
72
-
73
-
74
-
75
-
76
-
77
-
 78
78 -
 79
79 -
 80
80 -
 81
81 -
 82
82 -
 83
83 -
 84
84 -
 85
85 -
 86
86 -
 87
87 -
 88
88 -
 89
89 -
 90
90 -
 91
91 -
 92
92 -
 93
93 -
 94
94 -
 95
95 -
 96
96 -
 97
97 -
 98
98 -
99
-
100
-
101
-
102
-
103
-
104
-
105
-
106
-
107
-
108
-
109
-
110
-
111
-
112
-
113
-
114
-
115
-
116
-
117
-
118
-
119
-
120
-
121
-
122
-
123
-
124
-
125
-
126
-
127
-
128
-
129
-
130
-
131
-
132
-
133
-
134
-
135
-
136
-
137
-
138
-
139
-
140
-
141
-
142
-
143
-
144
-
145
-
146
-
147
-
148
-
149
-
150
-
151
-
152
-
153
-
154
-
155
-
156
-
157
-
158
-
159
-
160
-
161
-
162
-
163
-
164
-
165
-
166
-
167
-
168
-
169
-
170
-
171
-
172
-
173
-
174
-
175
-
176
-
177
-
178
-
179
-
180
-
181
-
182
-
183
-
184
 |
 |

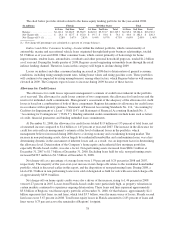
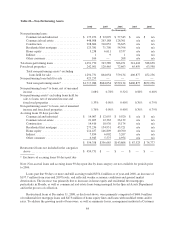
The chart below provides details related to the home equity lending portfolio for the year-ended 2008.
(In millions) Florida All Other States Total
1st Lien 2nd Lien Total 1st Lien 2nd Lien Total 1st Lien 2nd Lien Total
Balance ................. $2,121.6 $3,662.9 $5,784.5 $4,624.0 $5,721.7 $10,345.7 $6,745.6 $9,384.6 $16,130.2
Net Charge-offs .......... $ 24.3 $ 127.7 $ 152.0 $ 19.7 $ 54.6 $ 74.3 $ 44.0 $ 182.3 $ 226.3
Net Charge-off % (1) ...... 1.28% 3.67% 2.83% 0.44% 0.97% 0.73% 0.69% 2.00% 1.46%
(1) Net charge-off percentages are calculated as a percent of average balances.
Indirect and Other Consumer Lending—Loans within the indirect portfolio, which consist mainly of
automobile, marine and recreational vehicle loans originated through third-party business relationships, totaled
$3.9 billion as of year-end 2008. Other consumer loans, which consist primarily of borrowings for home
improvements, student loans, automobiles, overdrafts and other personal household purposes, totaled $1.2 billion
as of year end. During the fourth quarter of 2008, Regions ceased originating automobile loans through the retail
indirect lending channel. Therefore, loans in this category will begin to decline during 2009.
Losses on indirect and other consumer lending increased in 2008 due to deterioration of general economic
conditions, including rising unemployment rates, falling home values and rising gasoline costs. These portfolios
will continue to be impacted by rising unemployment, among other factors, which Regions believes will remain
elevated in 2009. The Company expects losses to increase during 2009 because of these factors.
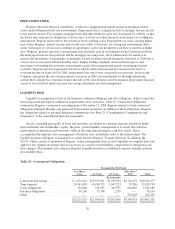
Allowance for Credit Losses
The allowance for credit losses represents management’s estimate of credit losses inherent in the portfolio
as of year-end. The allowance for credit losses consists of two components: the allowance for loan losses and the
reserve for unfunded credit commitments. Management’s assessment of the adequacy of the allowance for credit
losses is based on a combination of both of these components. Regions determines its allowance for credit losses
in accordance with regulatory guidance, Statement of Financial Accounting Standards No. 114, “Accounting by
Creditors for Impairment of a Loan” (“FAS 114”) and Statement of Financial Accounting Standards No. 5,
“Accounting for Contingencies” (“FAS 5”). Binding unfunded credit commitments include items such as letters
of credit, financial guarantees and binding unfunded loan commitments.
At December 31, 2008, the allowance for credit losses totaled $1.9 billion or 1.95 percent of total loans, net
of unearned income compared to $1.4 billion or 1.45 percent at year-end 2007. The increase in the allowance for
credit loss ratio reflects management’s estimate of the level of inherent losses in the portfolio, which
management believes increased during 2008 due to a slowing economy and a weakening housing market. The
increase in non-performing assets, driven largely by residential homebuilder and condominium loans, was a key
determining dynamic in the assessment of inherent losses and, as a result, was an important factor in determining
the allowance level. Deterioration of the Company’s home equity and residential first mortgage portfolios,
especially Florida-based credits, was also a factor. Non-performing assets increased from $864.1 million at
December 31, 2007 to $1.7 billion at December 31, 2008. Excluding loans held for sale, non-performing assets
increased $430.7 million to $1.3 billion at December 31, 2008.
Net charge-offs as a percentage of average loans were 1.59 percent and 0.29 percent in 2008 and 2007,
respectively. The majority of the year-over-year increase in net charge-offs relates to the residential homebuilder
portfolio, which is discussed earlier in this report, and the disposition of non-performing loans. During 2008, a
total of $1.3 billion in non-performing loans were sold or designated as held for sale with associated charge-offs
of approximately $639.0 million.
Net charge-offs on home equity credits were also a driver of the increase, rising to 1.46 percent in 2008
versus 0.27 percent in 2007. Losses from Florida-based credits were particularly high, as property valuations in
certain markets continued to experience ongoing deterioration. These loans and lines represent approximately
$5.8 billion of Regions’ total home equity portfolio at December 31, 2008. Of that balance, approximately $2.1
billion represents first liens; second liens, which total $3.7 billion, were the main source of losses. Florida second
lien losses were 3.67 percent in 2008. Total home equity losses in Florida amounted to 2.83 percent of loans and
lines versus 0.73 percent across the remainder of Regions’ footprint.
78