Regions Bank 2008 Annual Report Download - page 107
Download and view the complete annual report
Please find page 107 of the 2008 Regions Bank annual report below. You can navigate through the pages in the report by either clicking on the pages listed below, or by using the keyword search tool below to find specific information within the annual report.-
 1
1 -
2
-
3
-
4
-
5
-
6
-
7
-
8
-
9
-
10
-
11
-
12
-
13
-
14
-
15
-
16
-
17
-
18
-
19
-
20
-
21
-
22
-
23
-
24
-
25
-
26
-
27
-
28
-
29
-
30
-
31
-
32
-
33
-
34
-
35
-
36
-
37
-
38
-
39
-
40
-
41
-
42
-
43
-
44
-
45
-
46
-
47
-
48
-
49
-
50
-
51
-
52
-
53
-
54
-
55
-
56
-
57
-
58
-
59
-
60
-
61
-
62
-
63
-
64
-
65
-
66
-
67
-
68
-
69
-
70
-
71
-
72
-
73
-
74
-
75
-
76
-
77
-
78
-
79
-
80
-
81
-
82
-
83
-
84
-
85
-
86
-
87
-
88
-
89
-
90
-
91
-
92
-
93
-
94
-
95
-
96
-
 97
97 -
 98
98 -
 99
99 -
 100
100 -
 101
101 -
 102
102 -
 103
103 -
 104
104 -
 105
105 -
 106
106 -
 107
107 -
 108
108 -
 109
109 -
 110
110 -
 111
111 -
 112
112 -
 113
113 -
 114
114 -
 115
115 -
 116
116 -
 117
117 -
118
-
119
-
120
-
121
-
122
-
123
-
124
-
125
-
126
-
127
-
128
-
129
-
130
-
131
-
132
-
133
-
134
-
135
-
136
-
137
-
138
-
139
-
140
-
141
-
142
-
143
-
144
-
145
-
146
-
147
-
148
-
149
-
150
-
151
-
152
-
153
-
154
-
155
-
156
-
157
-
158
-
159
-
160
-
161
-
162
-
163
-
164
-
165
-
166
-
167
-
168
-
169
-
170
-
171
-
172
-
173
-
174
-
175
-
176
-
177
-
178
-
179
-
180
-
181
-
182
-
183
-
184
 |
 |

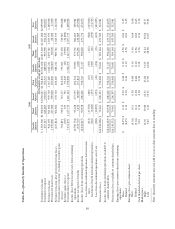
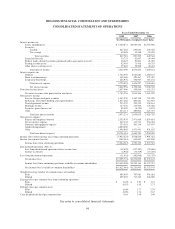
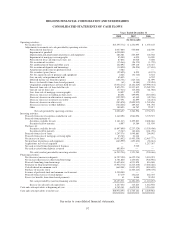
REGIONS FINANCIAL CORPORATION AND SUBSIDIARIES
CONSOLIDATED STATEMENTS OF CASH FLOWS
Years Ended December 31
2008 2007 2006
(In thousands)
Operating activities:
Net income (loss) ......................................................... $(5,595,774) $ 1,251,095 $ 1,353,145
Adjustments to reconcile net cash provided by operating activities:
Provision for loan losses ................................................ 2,057,000 555,000 142,500
Impairment of goodwill ................................................ 6,000,000 — —
Depreciation and amortization of premises and equipment ..................... 286,381 263,409 144,038
Impairment of mortgage servicing rights ................................... 85,000 6,000 16,000
Provision for losses on other real estate, net ................................. 87,836 10,010 5,698
Net accretion of securities .............................................. (15,366) (26,173) (1,720)
Net amortization of loans and other assets .................................. 122,092 259,110 178,347
Net accretion of deposits and borrowings .................................. (14,850) (58,504) (17,894)
Amortization of discount on preferred stock ................................ 3,382 — —
Net securities (gains) losses ............................................. (92,495) 8,553 (8,123)
Net loss (gain) on sale of premises and equipment ........................... 2,426 (32,746) 8,522
Loss on early extinguishment of debt ...................................... 65,405 — 6,532
Deferred income tax (benefit) expense ..................................... (406,751) (123,744) 61,099
Excess tax benefits from share-based payments .............................. (61) (8,484) (32,454)
Originations and purchases of loans held for sale ............................ (5,054,174) (8,181,669) (15,990,331)
Proceeds from sales of loans held for sale .................................. 5,823,723 11,537,812 15,282,578
Gain on sale of loans, net ............................................... (57,313) (65,632) (81,088)
Loss from sale of mortgage servicing rights ................................. 14,857 4,429 —
Decrease (increase) in trading account assets ................................ 88,491 439,094 (510,696)
(Increase) decrease in other interest-earning assets ........................... (392,292) 65,449 (42,746)
Decrease (increase) in interest receivable ................................... 157,591 44,899 (46,451)
(Increase) decrease in other assets ........................................ (583,878) (2,899,912) 1,762,856
(Decrease) increase in other liabilities ..................................... (764,266) 189,813 501,792
Other ............................................................... 189,493 48,787 22,917
Net cash provided by operating activities ............................... 2,006,457 3,286,596 2,754,521
Investing activities:
Proceeds from sale of securities available for sale ................................ 2,142,296 1,964,096 3,770,572
Proceeds from maturity of:
Securities available for sale ............................................. 3,181,213 2,495,803 2,608,866
Securities held to maturity .............................................. 8,997 14,384 151,939
Purchases of:
Securities available for sale ............................................. (6,847,899) (2,237,529) (5,550,408)
Securities held to maturity .............................................. (5,367) (40,812) (161,796)
Proceeds from sales of loans ................................................. 1,247,378 1,049,881 294,992
Proceeds from sales of mortgage servicing rights ................................ 43,763 21,148 —
Net increase in loans ....................................................... (6,433,052) (1,495,559) (2,467,777)
Net purchase of premises and equipment ....................................... (463,999) (453,832) (94,661)
Acquisitions, net of cash acquired ............................................ — — 1,217,587
Net cash received from disposition of business .................................. — 5,700 —
Net cash received from deposits assumed ...................................... 893,934 — —
Net cash (used in) provided by investing activities ........................... (6,232,736) 1,323,280 (230,686)
Financing activities:
Net (decrease) increase in deposits ............................................ (4,757,190) (6,422,374) 3,310,923
Net increase (decrease) in short-term borrowings ................................ 4,701,840 1,453,051 (944,956)
Proceeds from long-term borrowings .......................................... 11,605,418 6,933,828 816,048
Payments on long-term borrowings ........................................... (3,954,776) (4,223,810) (3,204,486)
Cash dividends on common stock ............................................ (669,001) (1,035,432) (894,805)
Purchase of treasury stock .................................................. — (1,363,213) (490,370)
Issuance of preferred stock and common stock warrant ............................ 3,500,000 — —
Proceeds from exercise of stock options ....................................... 27,179 154,813 264,335
Excess tax benefits from share-based payments .................................. 61 8,484 32,454
Net cash provided by (used in) financing activities ........................... 10,453,531 (4,494,653) (1,110,857)
Increase in cash and cash equivalents ...................................... 6,227,252 115,223 1,412,978
Cash and cash equivalents at beginning of year ...................................... 4,745,141 4,629,918 3,216,940
Cash and cash equivalents at end of year ........................................... $10,972,393 $ 4,745,141 $ 4,629,918
See notes to consolidated financial statements.
97