Regions Bank 2008 Annual Report Download - page 59
Download and view the complete annual report
Please find page 59 of the 2008 Regions Bank annual report below. You can navigate through the pages in the report by either clicking on the pages listed below, or by using the keyword search tool below to find specific information within the annual report.-
 1
1 -
2
-
3
-
4
-
5
-
6
-
7
-
8
-
9
-
10
-
11
-
12
-
13
-
14
-
15
-
16
-
17
-
18
-
19
-
20
-
21
-
22
-
23
-
24
-
25
-
26
-
27
-
28
-
29
-
30
-
31
-
32
-
33
-
34
-
35
-
36
-
37
-
38
-
39
-
40
-
41
-
42
-
43
-
44
-
45
-
46
-
47
-
48
-
 49
49 -
 50
50 -
 51
51 -
 52
52 -
 53
53 -
 54
54 -
 55
55 -
 56
56 -
 57
57 -
 58
58 -
 59
59 -
 60
60 -
 61
61 -
 62
62 -
 63
63 -
 64
64 -
 65
65 -
 66
66 -
 67
67 -
 68
68 -
 69
69 -
70
-
71
-
72
-
73
-
74
-
75
-
76
-
77
-
78
-
79
-
80
-
81
-
82
-
83
-
84
-
85
-
86
-
87
-
88
-
89
-
90
-
91
-
92
-
93
-
94
-
95
-
96
-
97
-
98
-
99
-
100
-
101
-
102
-
103
-
104
-
105
-
106
-
107
-
108
-
109
-
110
-
111
-
112
-
113
-
114
-
115
-
116
-
117
-
118
-
119
-
120
-
121
-
122
-
123
-
124
-
125
-
126
-
127
-
128
-
129
-
130
-
131
-
132
-
133
-
134
-
135
-
136
-
137
-
138
-
139
-
140
-
141
-
142
-
143
-
144
-
145
-
146
-
147
-
148
-
149
-
150
-
151
-
152
-
153
-
154
-
155
-
156
-
157
-
158
-
159
-
160
-
161
-
162
-
163
-
164
-
165
-
166
-
167
-
168
-
169
-
170
-
171
-
172
-
173
-
174
-
175
-
176
-
177
-
178
-
179
-
180
-
181
-
182
-
183
-
184
 |
 |
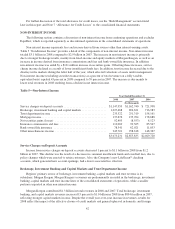
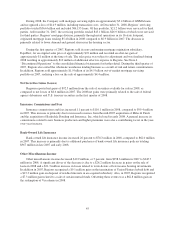
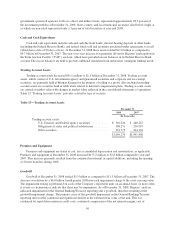
Other Real Estate Owned Expense
Other real estate owned (“OREO”) expenses include the cost of adjusting foreclosed properties to fair value
after these assets have been classified as OREO, as well as other costs to maintain the property. OREO expense
increased $86.9 million to $102.8 million in 2008 compared to $15.9 million in 2007, driven by steep valuation
declines and losses on the sale of foreclosed properties resulting from continued decline of the housing market.
Another contributing factor is increased costs related to operating and maintaining the foreclosed properties
during the holding period. Despite Regions’ aggressive and successful efforts to sell foreclosed properties,
balances increased $122.5 million to $243.0 million in 2008. See Note 11 “Other Real Estate” to the consolidated
financial statements.
Marketing
Marketing expense decreased $37.1 million during 2008, including a reduction of $30.2 million of merger-
related charges, to $96.9 million from $134.1 million in 2007. In 2007, marketing expense was higher due to
post-merger rebranding initiatives and marketing campaigns which ran to coincide with branch conversions, as
well as customer communications associated with branch conversions and consolidations.
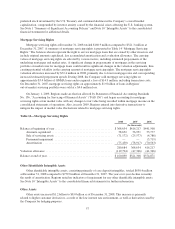
Goodwill Impairment
Regions incurred a $6.0 billion non-cash goodwill impairment charge as a result of a goodwill evaluation
performed in the fourth quarter of 2008. This evaluation indicated the estimated implied fair value of the General
Banking/Treasury reporting unit’s goodwill was less than its book value, therefore requiring the impairment
charge. Refer to Note 1 “Summary of Significant Accounting Policies” and Note 10 “Intangible Assets” to the
consolidated financial statements for further discussion.
Mortgage Servicing Rights Impairment
Mortgage servicing rights impairment increased $79.0 million to $85.0 million in 2008. The increase was
driven by the effects of changes in the interest rate environment in 2008.
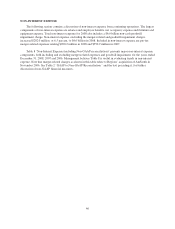
Other Miscellaneous Expenses
Other miscellaneous expenses include communications, valuation impairment charges, business
development services, and FDIC insurance. Other miscellaneous expenses increased slightly in 2008 compared to
2007. Included in other miscellaneous expenses are $49.4 million and $38.5 million write-downs on the
investment in two Morgan Keegan mutual funds during 2008 and 2007, respectively. Also in 2008, Regions
incurred a $65.4 million loss on early extinguishment of debt related to the redemption of subordinated notes.
Other miscellaneous expenses benefited from the recognition of a $28.4 million litigation expense reduction
related to Visa’s IPO during the first quarter of 2008. Regions had recorded a $51.5 million expense for Visa
litigation during the fourth quarter of 2007.
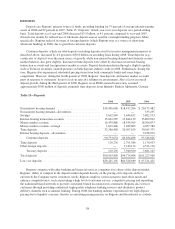
INCOME TAXES
Regions’ 2008 provision for income taxes from continuing operations decreased $993.8 million to a tax
benefit to $348.1 million compared to expense of $645.7 million in 2007, primarily due to lower consolidated
earnings combined with the $275 million benefit from settlement of uncertain tax positions resulting from the
resolution with the IRS of the Company’s federal uncertain tax positions for tax years 1999-2006.
Periodically, Regions invests in pass-through investment vehicles that generate tax credits, principally
low-income housing credits and non-conventional fuel source credits, which directly reduce Regions’ federal
income tax liability. Congress has enacted these tax credit programs to encourage capital inflows to these
49